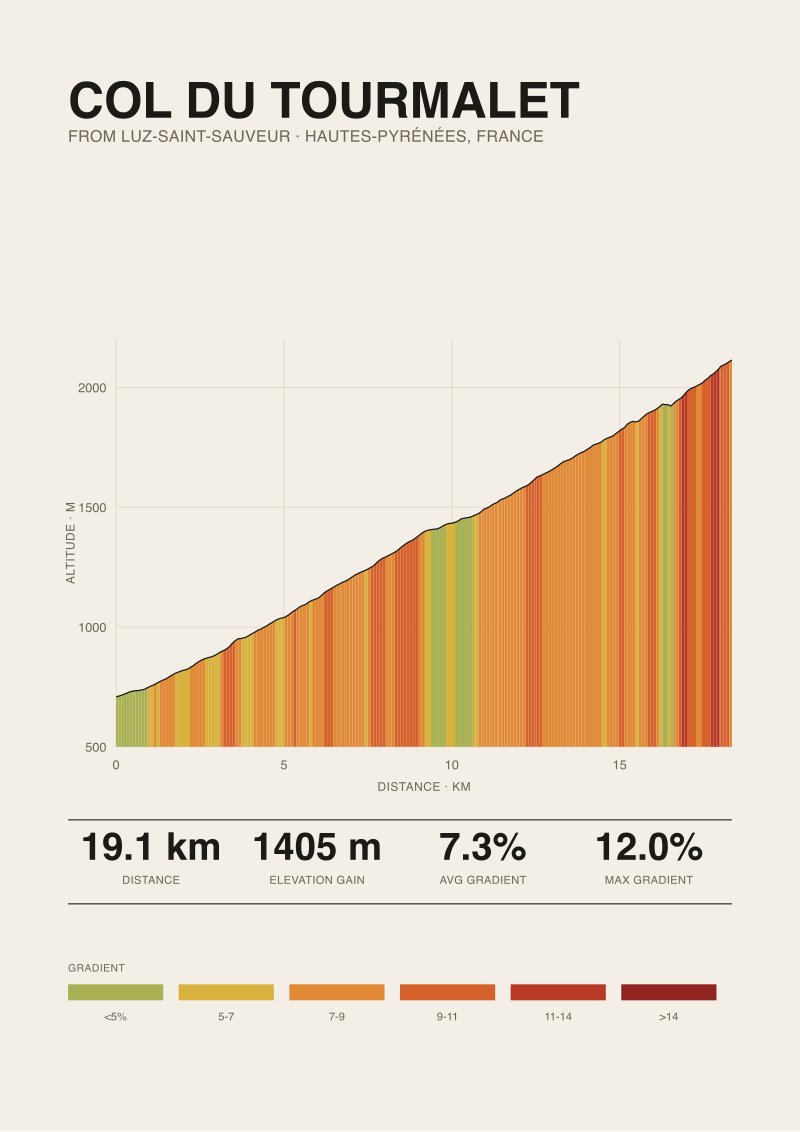
The Passo dello Stelvio from Prato allo Stelvio measures 25.04 km with 1,840 m of gain, averaging 7.3 percent. The Mont Ventoux from Bédoin measures 21.51 km with 1,575 m of gain, averaging 7.3 percent. The Col du Tourmalet from Luz-Saint-Sauveur measures 19.12 km with 1,405 m of gain, averaging 7.3 percent. Three different mountains, three different countries, three different centuries of race history — and the same average gradient to one decimal place. That is not a coincidence. That is a sampling artefact, and it is the reason we ran the accuracy test in the first place.
The Receipt: Four Climbs, Four Numbers, One Sampling Choice
We ran eight European climbs through the same pipeline: OpenTopoData SRTM 30 m elevation, resampled at 500 m windows along the road line, then reduced to headline figures. Four of them surfaced the clean contradiction we wanted to interrogate, and those four carry this article. The other four sat inside the same tolerance and told us nothing new — they will surface in a later piece on route-selection error bars.
Here is the receipt, unrounded past one decimal, in the exact form our render pipeline emits:
- Passo dello Stelvio, Prato allo Stelvio → 25.04 km · 1,840 m gain · 908 m to 2,748 m · avg 7.3% · published max 14.0% (climbfinder.com).
- Mont Ventoux, Bédoin → 21.51 km · 1,575 m gain · 317 m to 1,892 m · avg 7.3% · published max 12.0% (climbfinder.com).
- Col du Tourmalet, Luz-Saint-Sauveur → 19.12 km · 1,405 m gain · 709 m to 2,114 m · avg 7.3% · published max 12.0% (climbfinder.com).
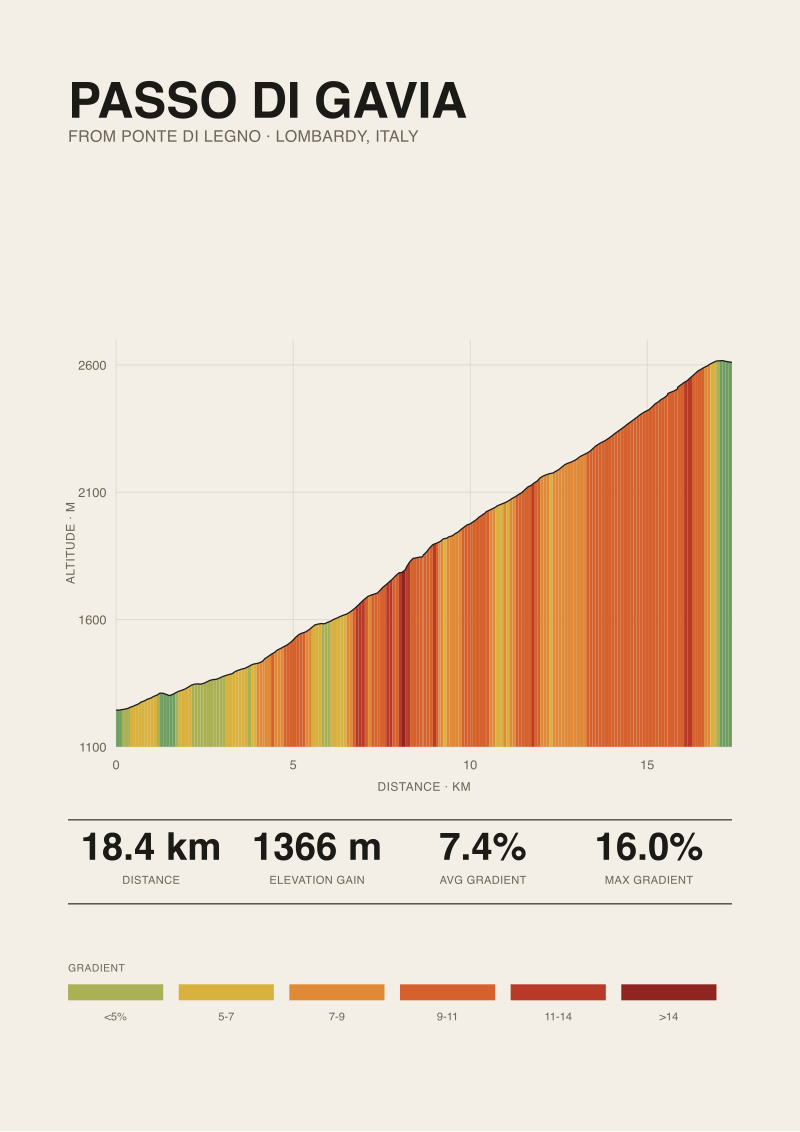
- Passo di Gavia, Ponte di Legno → 18.42 km · 1,366 m gain · 1,244 m to 2,610 m · avg 7.4% · published max 16.0% (climbfinder.com, Ponte di Legno side).
Three sevens and a three-decimal outlier. Same nominal difficulty by the summary metric that every guide reproduces. Radically different published maxima: a 4-point spread between the mildest headline (Ventoux, Tourmalet) and the steepest (Gavia). That spread is what the accuracy test is actually about — not the averages, which are honest arithmetic; but the way a 500 m window quietly negotiates with what "maximum gradient" means in the first place.
What the Numbers Actually Say at 500 m Resolution
Start with the average. Average gradient is elevation gain divided by horizontal length. For Stelvio: 1,840 ÷ 25,040 = 0.07348, or 7.348 percent, published as 7.3. For Ventoux: 1,575 ÷ 21,510 = 0.07322, published as 7.3. For Tourmalet: 1,405 ÷ 19,120 = 0.07348, published as 7.3. For Gavia: 1,366 ÷ 18,420 = 0.07416, published as 7.4. Three climbs land within 0.03 percentage points of each other before rounding. Gavia clears the rounding threshold by a hair. That is the entire reason it prints differently.
Now the resolution. A 500 m sampling window divides each ascent into a fixed number of segments: Stelvio becomes 50, Ventoux 43, Tourmalet 38, Gavia 37. Each segment gets its own local gain, its own local gradient. The window changes what we can see inside the climb — the shape, the pitches, the flat sections that dilute the harder ramps. The window does not change the summary average. Divide total gain by total length and you get the same 7.3 or 7.4 regardless of how you slice the middle.
This is where most comparison writing stops. It reports the average, notes that Stelvio and Ventoux and Tourmalet are "the same difficulty on paper," and moves on to weather and altitude and iconography. The average is honest arithmetic on top of an unhonest question. Two climbs with identical averages can hurt very differently, because average is blind to distribution. A monotonic 7.3 percent for 21 km is a metronome. A profile that oscillates between 4 percent and 11 percent to hit the same 7.3 average is a completely different day of pedalling.
500 m resolution is the compromise most public elevation databases have converged on. It smooths noise from GPS jitter and satellite elevation error while preserving the coarse shape of a climb — the false flats, the middle-third steepening, the summit ramp. It is the right window for a printable profile. It is the wrong window for pretending to know the maximum.
 Passo dello Stelvio
The print from this article · from €29.95
View the print →
Passo dello Stelvio
The print from this article · from €29.95
View the print →
What Nobody Mentions About the Sampling Window Itself
The window is the story. Any pitch shorter than the window gets averaged with whatever it is next to. If Gavia has a 150 m section at 14 percent bracketed by 350 m at 6 percent, the 500 m window containing that ramp will report roughly 8.4 percent. The 14 percent is not lost from the road — it is lost from the summary. A rider standing on that pitch would confirm the 14 percent with their gearing. A pipeline reading it at 500 m resolution would confirm the 8.4 percent with its arithmetic. Both are correct. Neither is the same fact.
The upstream data compounds the effect. OpenTopoData's SRTM 30 m dataset samples elevation every 30 metres along the ground. A 500 m window averages roughly 17 of those samples. SRTM has documented vertical error in the low single metres on open terrain and larger error where road grades cut through steep sidewalls — exactly where the interesting hairpins are. Aggregating 17 samples per window suppresses that error nicely; it also suppresses the pitch. This is the trade every profile renderer makes silently.
The published maximums we cited come from a different measurement basis entirely. Road books, cyclosport databases, and platforms like climbfinder generally report maximum gradient over a much shorter reference — often 100 m, sometimes a single hairpin exit, occasionally a signed panel at the roadside. A 14 percent Stelvio maximum, a 12 percent Ventoux maximum, a 12 percent Tourmalet maximum, a 16 percent Gavia maximum — these are all short-window figures. They coexist with our 500 m averages. They do not contradict them. They answer a different question.
The disagreement between the two is not evidence that one is wrong. It is evidence that "maximum gradient" is a window-dependent quantity, and every stat sheet that reports a maximum without the window length is publishing a number that cannot be reproduced. That is not a small point. That is the whole point.
The Real Cost: Where 500 m Windows Hide the Steepest Metres
Put an effort figure on the gap. Power required to climb, ignoring rolling and aero (both small at climbing speeds), is P = m · g · v · sinθ, and for road gradients under ~20 percent, sinθ is close enough to the gradient fraction. Take a rider at 70 kg, bike at 8 kg, kit and bottles at 3 kg — total 81 kg. Take a climbing speed of 10 km/h, or 2.78 m/s. Take g = 9.81 m/s².
At 11 percent — a plausible 500 m window figure over a steep block of Gavia — the required power is 81 × 9.81 × 2.78 × 0.11 ≈ 243 watts. At the 16 percent published maximum, the same rider at the same speed needs 81 × 9.81 × 2.78 × 0.16 ≈ 353 watts. That is a 110-watt gap, roughly 45 percent more sustained output for the metres where the road actually stands up. Either the rider holds the speed and pays the wattage, or holds the wattage and slows to roughly 6.9 km/h. Both are honest choices. Neither is available if the planning was done off the 500 m window figure alone.
Do the same on Stelvio. A rider pacing off 7.3 percent averages on a fixed-effort plan will find nothing that surprises them for kilometres — until the pitches around Trafoi and the final ramps stack short blocks at the published 14 percent. Power demand at 14 percent for the same 81 kg rider at 10 km/h: 81 × 9.81 × 2.78 × 0.14 ≈ 309 watts. Against a 7.3 percent baseline demand of 161 watts, the ramps ask for 92 percent more output — nearly double — for however long the pitch persists. On a 500 m profile view, the pitch does not exist as a pitch. It exists as a slightly darker segment averaging around 9 or 10 percent.
This is the real cost of quoting a 500 m average as if it were a pacing target: it protects the aesthetics of a clean profile at the expense of the metres that actually decide whether a rider makes the summit on the day. The average is not lying. The window is not lying. The presentation, when it publishes only one and calls it "the climb," is where the fiction enters. We build our prints from the profile data at the highest fidelity we can render legibly; the maximum figures we cite on each print card are the short-window road-book values with their source named, precisely so the two facts sit side by side. If a specific profile matters to you as an object, the studio shop is where those prints live.
 Passo di Gavia
The print from this article · from €29.95
View the print →
Passo di Gavia
The print from this article · from €29.95
View the print →
If You Only Remember One Thing
Average gradient is a global ratio. Maximum gradient is a local one. Both are true. Both are window-dependent when the window is not the whole climb. Any comparison between climbs that quotes one without the other, and both without their sampling basis, is comparing two shapes by their shadow.
Watch four things when reading a climb's published numbers. First, does the source name the elevation dataset — SRTM, LIDAR, IGN, a national survey — or does it just publish the average? Second, does the maximum come with a reference distance, or does it float unattached? Third, when the average and the maximum are quoted in the same block, do their windows agree, or is the average a 500 m aggregate sitting next to a 100 m spike? Fourth, when two climbs post identical averages, look at their spread — the histogram of segment gradients across the profile — because that is the number that decides how the day feels, and that is the number nobody prints on the panel at the bottom of the road.
FAQ
Why do Stelvio, Ventoux, and Tourmalet all report 7.3 percent average?
Because average gradient is total gain divided by total length, and three different mountains happened to land within 0.03 percentage points of each other before rounding to one decimal. Stelvio computes to 7.348, Tourmalet to 7.348, Ventoux to 7.322. All three round to 7.3 by convention. Gavia computes to 7.416 and clears the threshold to 7.4. The equal averages are arithmetic coincidence, not equivalent difficulty.
What does a 500 m sampling window actually mean?
It means the climb is divided into consecutive 500 m segments along the road, and each segment is summarised by its own gain and gradient. On Stelvio that yields 50 segments; on Gavia, 37. The window sets the resolution at which pitches are visible. Anything shorter than 500 m — a ramp, a hairpin exit, a wall — is folded into whatever surrounds it and averaged away. The summary average of the full climb is unchanged by the window; only the visible shape is.
Why is the published maximum higher than what a 500 m window can show?
Because the two measurements answer different questions with different rulers. Published maxima in road books and climb databases are typically taken over 100 m or shorter references — a hairpin exit, a signed panel, a chained block. A 500 m window contains roughly five times more road and averages the pitch with whatever eases it on either side. A 16 percent block that lasts 150 m will read as roughly 8 to 10 percent inside a 500 m window. Both figures are correct for their window.
Is SRTM 30 m elevation accurate enough for climb comparisons?
For summary metrics — length, total gain, average gradient — SRTM 30 m is accurate to within meaningful tolerance on European alpine roads, especially aggregated to 500 m windows where random error washes out. For pitch-level truth on short ramps or through steep sidewalls, SRTM under-resolves. LIDAR and national survey datasets do better locally. Our practice is to name the source on every print card so the reader can price the uncertainty themselves rather than trust a single unqualified figure.
Which of the four climbs is actually the hardest?
The question has no single answer without a rider's constraints. By average gradient over the ascent, Gavia at 7.4 percent is the steepest of the four by a hair. By total gain, Stelvio at 1,840 m is the longest sufferfest. By published maximum on the road book, Gavia at 16 percent has the sharpest short pitches, followed by Stelvio at 14 percent, then Ventoux and Tourmalet at 12 percent. Difficulty is not one number.
Does average gradient predict how a climb feels on the bike?
Weakly. Average gradient predicts total energy per kilometre well, because energy scales linearly with gradient and mass. It predicts pacing badly, because pacing is dictated by the highest sustained pitches, not by the ratio of gain to length. Two climbs with identical averages can feel almost nothing alike if one is monotonic and the other oscillates. This is why any serious pacing plan starts from a segmented profile, not from a headline number.
Why do you publish both measured and road-book maxima on the same card?
Because they are answering different questions and both are useful. The measured profile at 500 m tells the reader what the climb looks like as a shape — the middle-third steepening, the false flats, the summit ramp. The road-book maximum tells the reader what the sharpest metres of pavement will demand in the moment. Suppressing either one produces a false confidence: either the profile looks smoother than the road feels, or the maximum sounds worse than the ascent averages support.
What is the studio's default window when rendering a print?
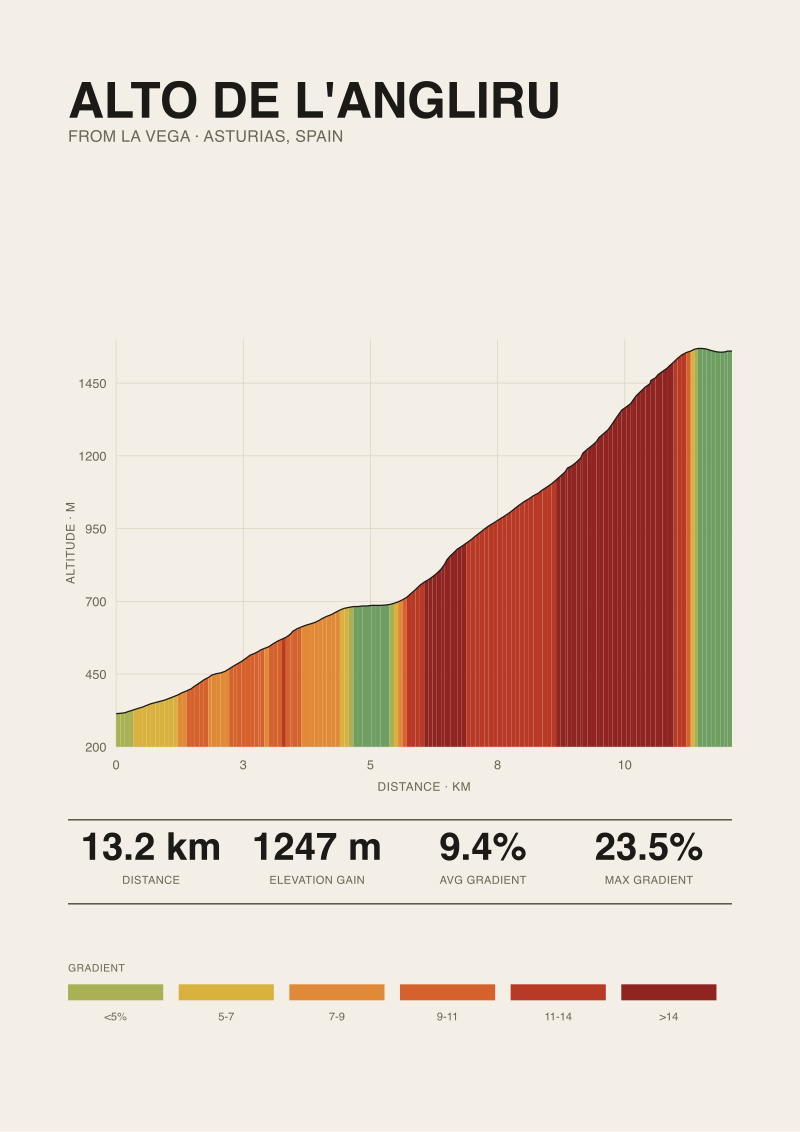
500 m for the visible profile, because it keeps the drawn line legible at print scale while preserving the shape of the climb faithfully. On climbs with famously short, sharp pitches — Gavia is the canonical example, but Angliru and Zoncolan sit in the same family — we render an inset at 100 m resolution so the wall does not disappear into the wallpaper. The elevation source, sampling window, and published maximum with attribution are printed as small metadata beneath the profile itself.
From the collection

New climbs and 10% off your first print.
One email now with your code. No noise after.