The Passo dello Stelvio, Mont Ventoux, the Col du Tourmalet, and the Passo di Gavia — four of the most photographed climbs in European road cycling — share a number. Their average gradient, measured on our profiles from OpenTopoData SRTM data, rounds to 7.3 or 7.4 percent. If average gradient told the truth about a climb, these four roads would feel roughly interchangeable to your legs.
They do not. Riders who have done all four will tell you this without hesitation, and if you have done three you already know which sentence comes next. The number that every guidebook prints at the top of every climb page — the single decimal, the tidy figure that lets you rank climbs on a spreadsheet — is the least useful data point on the profile. What follows is a measured argument about which number is more useful in its place, and the honest answer is that neither of the two you were about to compare wins on its own.
| Dimension | Stelvio (Prato) | Ventoux (Bédoin) | Tourmalet (Luz) | Gavia (Ponte di Legno) |
|---|---|---|---|---|
| Length (km) | 25.04 | 21.51 | 19.12 | 18.42 |
| Elevation gain (m) | 1,840 | 1,575 | 1,405 | 1,366 |
| Average gradient (%) | 7.3 | 7.3 | 7.3 | 7.4 |
| Max gradient, published (%) | 14.0 | 12.0 | 12.0 | 16.0 |
| Start elevation (m) | 908 | 317 | 709 | 1,244 |
| Summit elevation (m) | 2,748 | 1,892 | 2,114 | 2,610 |
| Max ÷ average ratio | 1.92 | 1.64 | 1.64 | 2.16 |
Length and elevation gain from our own profile measurements (OpenTopoData SRTM 30m). Maximum gradients are the published road-book figures cited by climbfinder.com; we distinguish these from our profile data deliberately, and one of the sections below explains why.
What Average Gradient Actually Measures
Average gradient is a division. Elevation gain divided by horizontal distance, expressed as a percentage. Nothing more. It is the number you would compute if you flattened the entire climb into a single straight ramp of uniform pitch and asked what pitch that ramp would have.
Four climbs on our table produce almost the same answer to that division. The Stelvio from Prato allo Stelvio: 1,840 metres over 25.04 kilometres, 7.3 percent. Mont Ventoux from Bédoin: 1,575 over 21.51, also 7.3. The Tourmalet from Luz-Saint-Sauveur: 1,405 over 19.12, again 7.3. The Gavia from Ponte di Legno rounds one decimal higher at 7.4. If you were shopping for a climb using average gradient as your metric, you would conclude these four are equivalent workloads at different lengths.
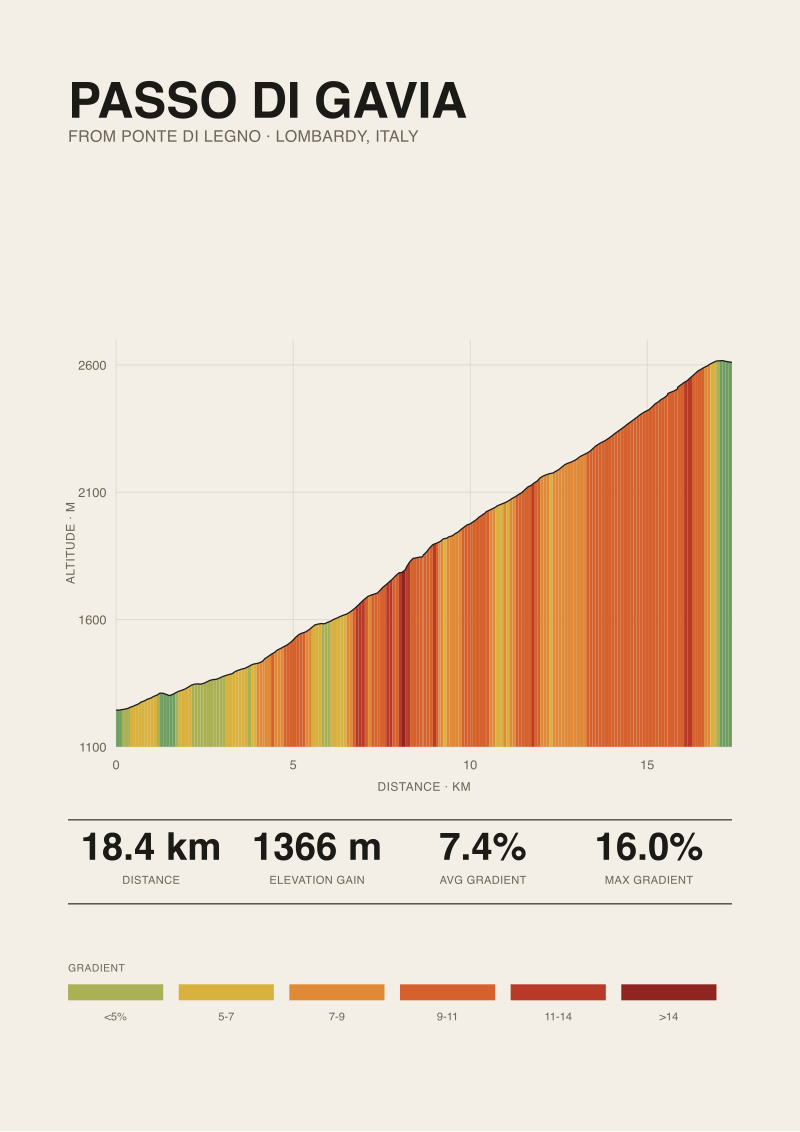
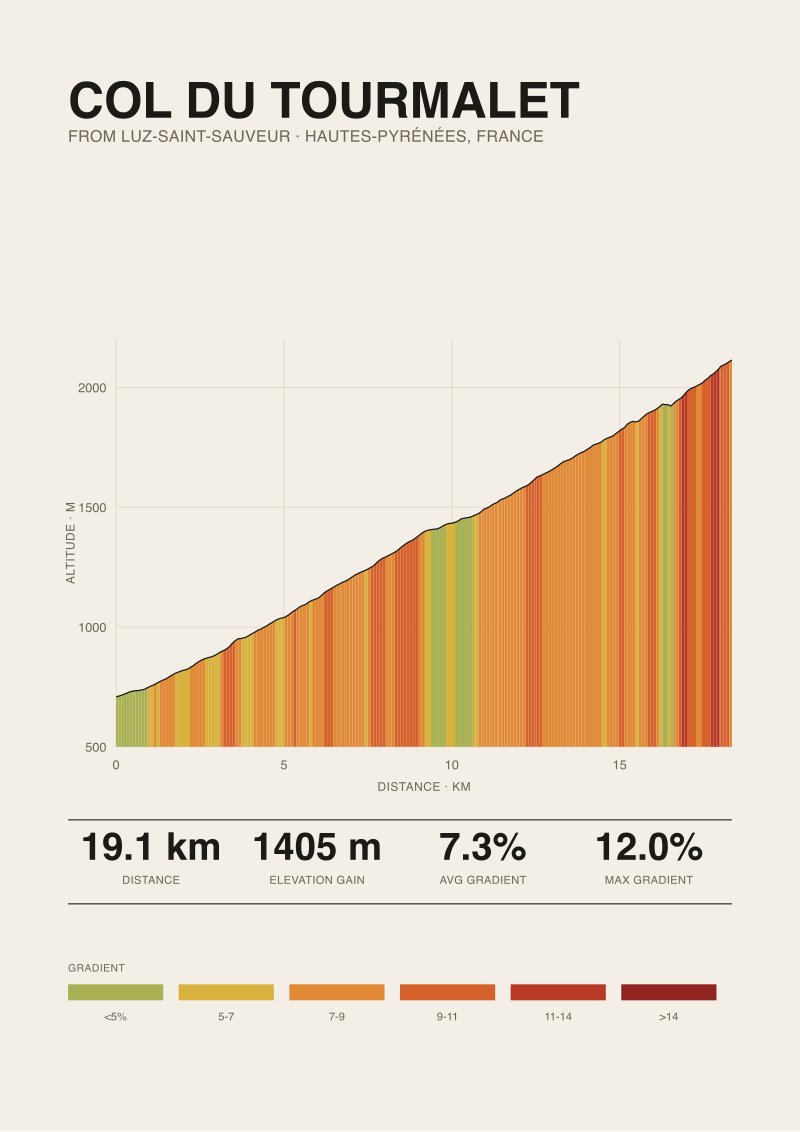
The Stelvio is a road that climbs steadily through forty-eight numbered hairpins for the better part of two hours. The Ventoux from Bédoin has a shallow first six kilometres through the vineyards and then a wall through the Forêt du Bédoin that averages nine percent for nine kilometres without meaningful respite. The Tourmalet has kicks in its middle section that the average never sees. The Gavia has a section near the top that a road book calls sixteen percent and that our profile confirms as the steepest sustained pitch in the four.
Average gradient tells you what a climb would feel like if the climb behaved like its own arithmetic mean. No climb does.
What Maximum Gradient Actually Measures
Maximum gradient is the steepest slope encountered anywhere along the road, usually measured over a short segment — a hundred metres, sometimes fifty. It is a peak reading, not a sustained one. And unlike average gradient, which we can derive with confidence from elevation data, the maximum published for a climb depends heavily on who measured it and how.
The Gavia's published maximum of sixteen percent comes from the road-book tradition. The Stelvio's fourteen percent comes from the same tradition. Ventoux and Tourmalet both sit at twelve percent. These are the numbers climbers pass around and the numbers cycling magazines print. Our elevation model, based on thirty-metre satellite data, cannot reliably confirm a hundred-metre pitch of sixteen percent — the resolution is not fine enough. This is not a failure of our data. It is a limit of what satellite topography can resolve, and it is why we cite the road-book source explicitly rather than replacing it with a suspiciously precise figure of our own.
The problem with maximum gradient as a decision tool is that it treats a moment as a summary. A climb with one violent hairpin at sixteen percent surrounded by two kilometres of five percent is a fundamentally different animal from a climb that sits at ten percent for three kilometres without a break. The first has a higher published maximum. The second is harder. Maximum gradient rewards drama; it does not measure suffering.
 Mont Ventoux
The print from this article · from €29.95
View the print →
Mont Ventoux
The print from this article · from €29.95
View the print →
Length: The Multiplier That Both Numbers Ignore
The Stelvio from Prato is 25.04 kilometres. The Gavia from Ponte di Legno is 18.42 kilometres. That is a 36 percent difference in duration at any given power output, and it is invisible in the two numbers most climb pages lead with.
Length interacts with gradient in a way that neither number captures alone. On a climb of similar average, a longer road is not just "the same effort for longer". It is a compounding effort. Glycogen depletes on a schedule the average cannot see. Altitude effects accrue with time. The mental cost of remaining seated in a low gear for two hours is different in kind from the cost of remaining in the same gear for seventy minutes. Riders who have done both the Stelvio and the Tourmalet on the same trip report this every time.
Length is also the number that decides whether maximum gradient matters. A twelve percent kick two kilometres from the top of a nineteen-kilometre climb — the Tourmalet's approximate shape — arrives at a moment when the legs have been climbing for seventy minutes. The same twelve percent kick two kilometres into a fifty-kilometre ride is a shrug. Maximum gradient is a function of what came before it, and what came before it is length.
If you must choose one number to include on a climb page, it should be length. Neither average nor max is intelligible without it.
Start and Summit Altitude: The Third Number You Should Ask For
The four climbs on our table finish at very different altitudes. The Stelvio tops out at 2,748 metres. The Gavia at 2,610. The Tourmalet at 2,114. The Ventoux at 1,892. These are meaningful differences, and they are the reason the same seven-and-a-third-percent gradient does not produce the same suffering.
Above roughly 2,000 metres, aerobic capacity begins to fall measurably for most riders. The Stelvio spends the last five kilometres in that band. The Gavia spends its last three. The Ventoux, despite its reputation, tops out below the altitude where physiology starts to bend against you — the Ventoux's suffering is a function of the exposed limestone summit and the mistral wind, not thin air. The Tourmalet sits between: a summit at 2,114 metres, brushing the threshold.
The starting altitude matters as much and is discussed less. The Gavia starts at 1,244 metres — you begin the climb already at an altitude where the Ventoux's road from Bédoin has not yet started to point up. A climb that begins high finishes higher for the same vertical gain, and the last third of the effort takes place in thinner air throughout.
The number a climb page should print alongside length and gradient is the summit elevation. It is the single most predictive figure for how a climb of otherwise similar profile will feel in the final third. The road-book tradition, oddly, agrees with us here: professionals reading a stage brief read summit altitude first.
 Passo di Gavia
The print from this article · from €29.95
View the print →
Passo di Gavia
The print from this article · from €29.95
View the print →
The Distance Between Average and Peak
The ratio of maximum gradient to average gradient is a rough proxy for how uneven a climb is. On our four, the ratios spread wider than the individual numbers suggest: Ventoux and Tourmalet at 1.64, Stelvio at 1.92, Gavia at 2.16.
Read the extremes. The Ventoux from Bédoin is a climb whose maximum is only 64 percent above its average — meaning the pitch above the average is not vastly steeper than the average itself. The Ventoux hurts because it stays at nine to ten percent for a long stretch through the forest, not because it spikes. The Gavia's ratio of 2.16 says the opposite: the climb has moments of published sixteen percent that live more than double its average, meaning the road spends most of its length below seven percent and pays it back in short, memorable walls.
Two climbs of identical average gradient with different ratios ride differently in a way you cannot rehearse for on a home trainer. The low-ratio climb is a metabolic problem: pick a sustainable power and hold it. The high-ratio climb is a pacing problem: the walls will punish an aggressive early pace and reward a rider who spent the first half in a lower gear than felt necessary.
If a climb page listed only three numbers, we would want length, summit altitude, and this ratio. Average and maximum on their own do not tell you which shape of climb is waiting.
Which Dimension Actually Matters Most
None of the numbers on that table matters most in isolation. What matters is the shape they describe together, and the shape is what most climb pages hide by leading with the two least informative figures on it. A climb of 7.3 percent average, 12 percent maximum, 21 kilometres long, summiting at 1,892 metres is a Ventoux. A climb of 7.4 percent average, 16 percent maximum, 18 kilometres long, summiting at 2,610 metres is a Gavia. These are not close cousins. They are different sports on the same table.
The reason average and maximum dominate every climb page is that they are the two numbers cheapest to compute and easiest to compare. That is a fact about publishing, not about climbs. If you want to actually understand what a road will do to you, read the length, the summit altitude, and the shape of the profile — where the steep bit lives, whether the climb ramps up or eases at the top, how long you spend above two thousand metres. Our own climb prints at see the Mont Ventoux print exist because a rider who has done these roads reads the profile shape the way a musician reads a score: not for its average pitch, but for where the road decides to raise its voice.
FAQ
If two climbs have the same average gradient, will they feel the same?
Almost never. The Stelvio, Ventoux, Tourmalet, and Gavia all sit at 7.3–7.4 percent average and produce four distinct experiences. Length, summit altitude, and where the steepest kilometres live inside the climb matter as much as the average. A climb whose steep sections are stacked at the top rides very differently from one that puts them in the middle, even when the arithmetic mean is identical.
Why do published maximum gradients sometimes disagree with elevation data?
Because road-book maximums are measured on the road over short segments — sometimes fifty metres — while satellite elevation models like SRTM operate at thirty-metre resolution, which cannot cleanly resolve very short, very steep pitches. When we cite a maximum of 16 percent for the Gavia or 14 percent for the Stelvio, we name the source (climbfinder.com) because the number is a road-book figure our profile data confirms as plausible but cannot independently pin down.
Is a high maximum gradient more painful than a high average?
Not necessarily. A single hundred-metre pitch at 14 percent surrounded by shallower terrain is a moment. A sustained six-kilometre stretch at 9 percent is a metabolic event that lasts thirty minutes. Riders often overestimate the cost of the spike and underestimate the cost of the sustained. Mont Ventoux from Bédoin, whose published maximum is 12 percent, hurts less because of that number than because of the nine-kilometre forest section that averages close to nine.
What number would you print on a climb page if you could only pick three?
Length in kilometres, elevation gain in metres, and summit altitude in metres. Length tells you duration. Gain tells you work. Summit altitude tells you whether the last third of the effort takes place in air thin enough to matter. Average gradient is derivable from the first two, and maximum gradient is a decoration without the profile shape around it. Our own climb prints lead with these three.
Does altitude actually change how a climb of the same gradient feels?
Yes, above roughly 2,000 metres for most riders. Aerobic capacity begins to bend measurably as air thins. The Stelvio's final five kilometres, all above 2,000 metres and topping at 2,748, produce a suffering that the same gradient at sea level would not. The Gavia and its 2,610-metre summit sit in the same band. The Ventoux, at 1,892, does not — its difficulty is wind, exposure, and the sustained middle section, not altitude.
Why do professional stage briefs lead with summit altitude?
Because a pro reading a stage brief is trying to predict where the decisive moment of the race will fall, and altitude is a strong predictor. A summit above 2,000 metres shifts the physiological cost of the last kilometres in a way that reshuffles the group. The 1988 Giro stage over the Gavia is remembered partly for the snow and partly because 2,610 metres of altitude in June exposed differences between riders that a lower summit would have hidden.
From the collection


New climbs and 10% off your first print.
One email now with your code. No noise after.