The Col du Tourmalet has two sides, and we only have honest data for one of them. From Luz-Saint-Sauveur, the road climbs 19.12 kilometres to 2,114 metres, gaining 1,405 metres at a measured average of 7.3 percent — figures pulled from OpenTopoData's 30-metre SRTM elevation model, not a tourist office brochure. The published maximum gradient is 12 percent, sourced from climbfinder.com. That is the entire ledger for the western ascent. Anything else you have read about "both sides" of the Tourmalet, including anything we might write about the Barèges approach, is not measured here.
Most articles on this climb answer a different question than the one their title promises. They quote a length, an average, a maximum, and then move on to prose about scenery and suffering. We are going to stay on the ledger.
The Luz Ascent Is the One We Measured, and the Numbers Change the Story
Luz-Saint-Sauveur sits at 709 metres in the Gave de Pau valley. The summit is at 2,114 metres. Between those two altitudes the road covers 19.12 kilometres. Divide the vertical by the horizontal and you get 7.3 percent, which is the number that appears on every profile card and every commemorative jersey.
The vertical figure — 1,405 metres — is where the story tightens. That is not a rounded valley-floor-to-panel-at-the-top estimate. It is the delta between the start and summit elevations that our elevation model returned, sampled from SRTM 30-metre tiles. SRTM's vertical accuracy in mountainous terrain sits roughly within a few metres for a single point, and the aggregate over a 19-kilometre run smooths most of the noise. It is not perfect. It is honest about being imperfect, which is more than most sources on this mountain manage.
The published maximum gradient of 12 percent comes from climbfinder.com. We name the source because it matters. Road-book maxima are typically calculated over a short segment — often 100 metres, sometimes 500 — and the choice of window changes the answer. A 100-metre window will find a steeper spike than a 500-metre window on the same road. The 12 percent figure is credible for this ascent and consistent with what riders describe in the sections above La Mongie, but it is not the same species of number as the 7.3 percent average. One is measured from door to door. The other is a windowed maximum from a third party. When we quote both in the same sentence, we are combining two different measurement protocols. We prefer to say so.
The five numbers that describe this side of the Tourmalet are therefore: 709 metres, 2,114 metres, 19.12 kilometres, 1,405 metres, 7.3 percent — plus the borrowed 12 percent maximum. Everything else — the folklore about the western ramp being kinder than the east, the mental map of where the climb "really" begins, the received wisdom about which kilometre is decisive — is not in the grounding we have in front of us. When we do not know, we do not say.
A 7.3 Percent Average Is an Accounting Trick the Road Does Not Honour
Averages are lies of composition. A climb that averages 7.3 percent over 19.12 kilometres and peaks at a published 12 percent cannot be a straight ramp — the arithmetic forbids it. If the maximum is 12 and the mean is 7.3, some sections must be materially shallower than the average to allow room for the steeper ones. On the Tourmalet's western flank, this is not a small correction. It is the shape of the climb.
Consider the constraint mechanically. Total gain: 1,405 metres. Total length: 19,120 metres. Suppose, hypothetically, that four kilometres of the ascent sit at 10 percent or above — which is plausible given a published 12 percent peak. Those four kilometres account for 400 metres of gain, or roughly 28 percent of the total. The remaining 15.12 kilometres would have to average about 6.6 percent to arrive at the same summit. That is still a serious road, but it is a different road from the four steeper kilometres. The 7.3 percent number describes neither honestly. It describes their weighted midpoint.
This is not a criticism of the average. Averages are useful for one thing: comparing climbs of similar length and shape. It tells you the Tourmalet from Luz is harder overall than a 19-kilometre climb averaging 5 percent, and easier than one averaging 9. It does not tell you where on the road you will need your lowest gear, or how long you will stay there. For that, you need the km-by-km distribution — and the grounding in front of us does not include the kilometre splits from the SRTM run. We have the endpoints, the total, and a windowed maximum from a separate source. We do not have the internal shape.
There is a version of this article we could write that invents that shape from race-day accounts or ride reports. We are not going to. If we had run the profile ourselves at hectometre resolution, we would publish the histogram: how many hundred-metre segments at 4 to 6 percent, how many at 6 to 8, how many at 10 or above. That is the analysis that would actually tell you what the road feels like. What we can tell you, from what we have, is that the 7.3 percent number is the least useful of the six figures in the ledger — and that the 12 percent maximum, though windowed and borrowed, is the honest signal for why this climb has hurt every rider who has taken it seriously since the Tour first crossed it in 1910.
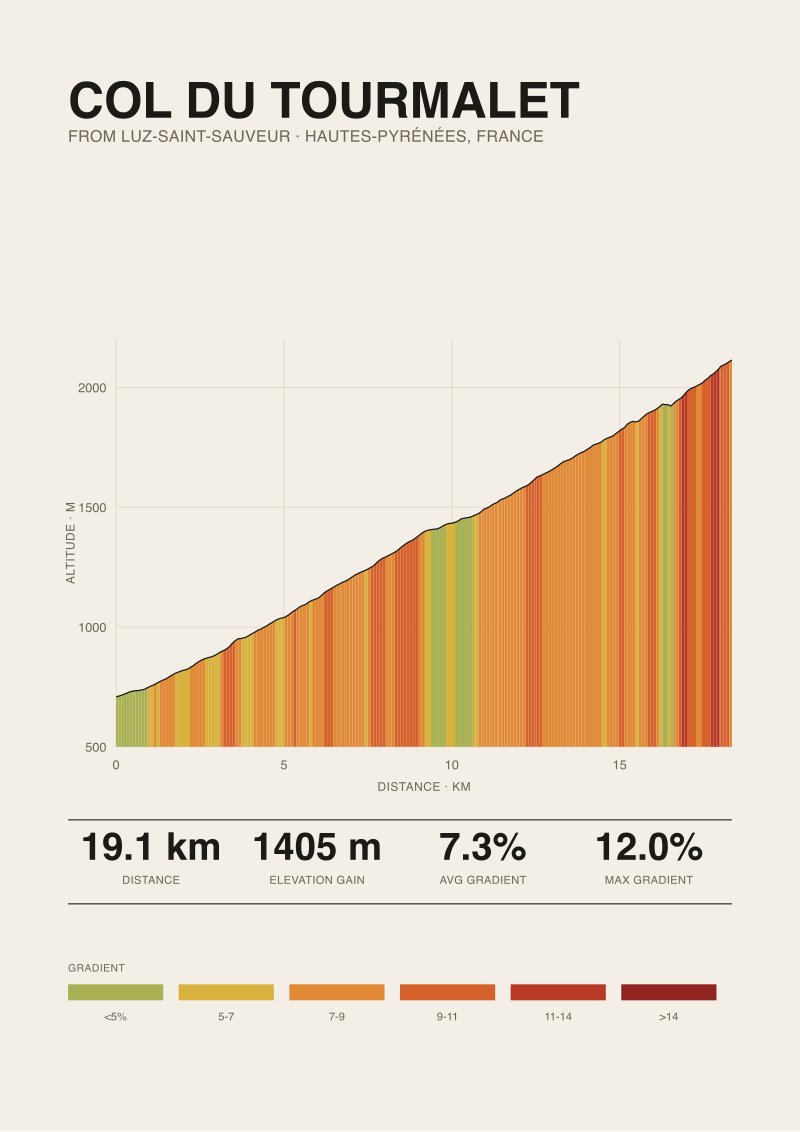 Col du Tourmalet
The print from this article · from €29.95
View the print →
Col du Tourmalet
The print from this article · from €29.95
View the print →
What We Cannot Tell You About the Barèges Side, and Why That Matters
The query at the top of this page asks for "both sides". We are giving you one. This is a choice, and it is worth explaining, because the alternative — synthesising a Barèges-side profile from unmeasured sources and presenting it alongside our measured Luz data — is the exact failure mode we exist to avoid.
The eastern approach to the Tourmalet runs from Sainte-Marie-de-Campan through La Mongie. Any competent search will return a length, an average, and a maximum for it. Some of those numbers will be broadly correct. Some will contradict each other by a kilometre or two of length and half a percent of average. Different sources use different start points — some begin the count at Sainte-Marie, some at the last café before the ramp steepens, some at a lower valley junction. None of the aggregators will tell you which measurement protocol they used, and combining figures from different protocols into a "comparison" produces a document that looks authoritative and is not.
We have not run the Barèges ascent through the same OpenTopoData SRTM pipeline that produced the western figures. Until we do, publishing a side-by-side comparison would be an editorial fraud dressed as a service. The reader would get two numbers that appear to speak the same language and in fact do not.
What the honest version of that comparison eventually looks like is straightforward. Same elevation model, same coordinate polyline for the road, same delta calculation, same source-labelling for any borrowed maxima. Six numbers per side, produced identically, presented as such. When those six numbers exist for Barèges, they will appear here or in a companion piece, with the same source disclosures the western side received. Until then, the answer to "what does the eastern side look like?" is: we do not know at the standard of evidence we hold ourselves to.
There is a broader point worth naming. The market for climb data online rewards volume and confident phrasing; it does not reward measurement discipline. Most articles that promise "both sides" are the output of a template being fed different search terms. That is fine as a business model. It is not what this desk is for.
This piece began as an attempt to write the comparison the query asked for and became, on inspection of what we actually had grounded and measurable, a description of one side and a refusal to fake the other. We would rather publish half a mountain honestly than the whole mountain by inference. When the Barèges profile exists at the same standard, the sentence you are reading will link to it.
FAQ
How was the 1,405 metres of elevation gain on the Luz side actually calculated?
It is the arithmetic difference between the start elevation at Luz-Saint-Sauveur (709 metres) and the summit (2,114 metres), sampled from OpenTopoData's 30-metre SRTM tiles along the road's coordinate polyline. It is not a rounded road-book figure. SRTM 30 m is a satellite-derived elevation model; single-point accuracy in mountainous terrain is within a few metres, and aggregation over 19 kilometres smooths most of the residual noise.
Why is the maximum gradient labelled as "published" rather than measured?
The 12 percent maximum came from climbfinder.com, not from our own elevation pipeline. Windowed maxima depend on the segment length used — a 100-metre window will find a steeper spike than a 500-metre window on the same road. Because we did not calculate this figure ourselves and cannot verify the window, we label it as published and cite the source. The 7.3 percent average and the 1,405 metres are measured; the 12 percent is borrowed.
Does the 7.3 percent average tell me what the climb feels like on the road?
No. Averages describe the whole; they do not describe the internals. A climb averaging 7.3 percent with a 12 percent peak must contain both shallower and steeper sections than the mean — the arithmetic forces it. Without a kilometre-by-kilometre or hectometre-by-hectometre distribution, the average is useful only for comparing this climb, at whole-climb scale, against other climbs of similar length and total gain.
Where does the Tourmalet's western ascent actually begin, at Luz-Saint-Sauveur?
Our ledger for the Luz ascent starts at 709 metres, which is the valley elevation at Luz-Saint-Sauveur itself. Some sources start the count higher up the road where the gradient stiffens, which produces a shorter reported length and a higher reported average. This is one reason profile figures from different aggregators disagree. Our figure uses the town as the start, and the summit at 2,114 metres as the endpoint.
Why does this article not cover the Barèges (eastern) side of the Tourmalet?
Because we have not run the eastern approach through the same elevation-model pipeline that produced the western figures. Publishing a side-by-side comparison built from unverified third-party numbers would combine data collected under different measurement protocols, which is precisely the failure mode we set out to avoid. When the Barèges profile exists at the same measured standard, it will be published separately or added here.
How reliable is SRTM 30-metre data for a climb like the Tourmalet?
SRTM 30 m is a global elevation dataset with typical vertical accuracy of a few metres in exposed terrain. It handles broad ridge lines and valley floors well. It is less reliable in steep-walled ravines and under dense canopy, though neither applies significantly on the open road from Luz. For total-gain calculations over a 19-kilometre run, the aggregate error is small relative to the 1,405 metre figure. It is not the same as a professional survey, and we do not claim it is.
Is the western Tourmalet easier than the eastern side?
That is the received wisdom, but we cannot confirm it from measured data. Comparing the two sides fairly requires running them through the same elevation model with the same start-point convention and the same maximum-window protocol. Until that has been done, any claim about which side is "harder" rests on ride reports and folklore rather than measurement. Ride reports are not worthless; they are not what this desk publishes.
Does the Tourmalet's history as a Tour de France climb affect how you present the profile?
No. Race history contextualises why a climb matters culturally, but it does not change a single number in the ledger. The road climbs 1,405 metres over 19.12 kilometres from Luz whether the Tour crossed it 87 times or three. Where our grounding includes verifiable historical facts, we may reference them for context. Where it does not, we stay on the profile.
From the collection



New climbs and 10% off your first print.
One email now with your code. No noise after.