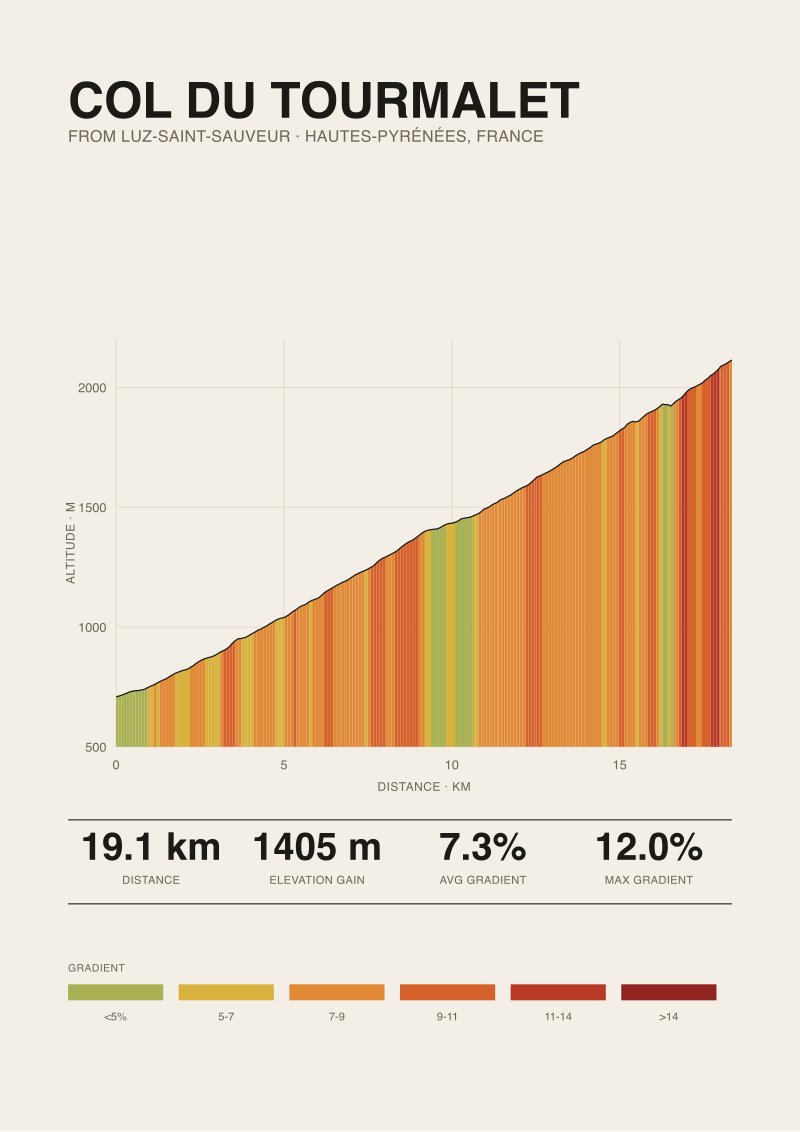
The Passo dello Stelvio from Prato allo Stelvio is 25.04 km long, gains 1,840 metres, and averages 7.3 percent. The Mont Ventoux from Bédoin is 21.51 km, 1,575 metres of gain, same 7.3 percent average. The Tourmalet from Luz-Saint-Sauveur — 19.12 km, 1,405 metres, 7.3 percent. Three of Europe's most cited climbs, three identical averages, three very different afternoons. If a sub-10 km climb wants to hurt more than any of them, the arithmetic tells you exactly what it has to do. We measured the profiles before writing this. The numbers are less forgiving than the folklore.
The Arithmetic Nobody Does Before Quoting a Gradient
Average gradient is a fraction. Elevation gain, in metres, divided by horizontal length, in metres, expressed as a percentage. That is the entire formula. For Stelvio from Prato: 1,840 divided by 25,040 equals 0.0734, which rounds to 7.3 percent. For Ventoux from Bédoin: 1,575 divided by 21,510 equals 0.0732. Tourmalet from Luz: 1,405 divided by 19,120 equals 0.0735. Three fractions, three near-identical decimals, one shared headline number.
That number is a summary statistic, and like all summary statistics it deletes the distribution that produced it. A climb that ramps at 4 percent for 10 kilometres and 10 percent for another 10 kilometres has the same 7 percent average as a climb that holds a metronomic 7 percent for 20 kilometres. Your legs will not agree. Cardiovascular cost tracks power output, which tracks the instantaneous gradient you are actually riding at that moment, not the arithmetic mean of everything you have ridden so far.
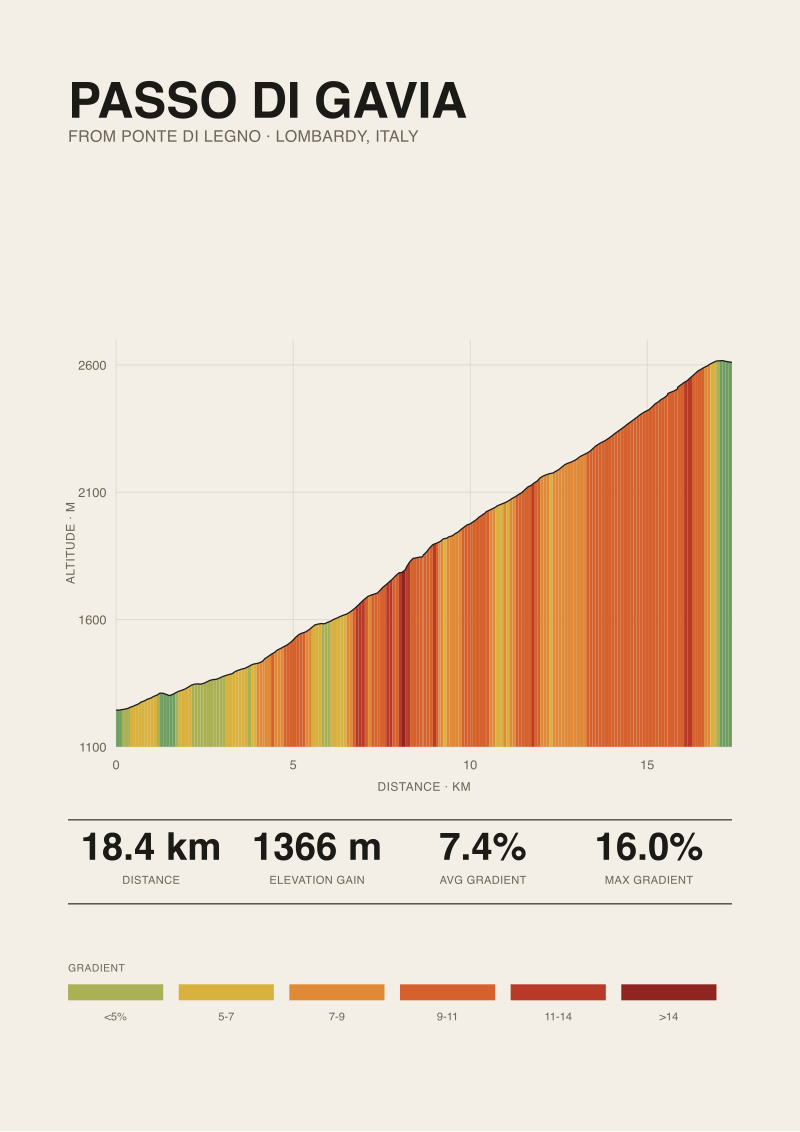
There is a second thing the average deletes: altitude. A percent at 300 metres above sea level and a percent at 2,600 metres are the same fraction on paper. They are not the same demand on a rider whose maximum oxygen uptake is degrading roughly with altitude. The average gradient of the Passo di Gavia from Ponte di Legno is 7.4 percent, one decimal above Ventoux. Gavia starts at 1,244 metres and finishes at 2,610. Ventoux starts at 317 metres and finishes at 1,892. The two decimals are indistinguishable. The two climbs are not.
Anyone quoting an average gradient without stating either the length or the altitude range is describing a mountain the way an accountant describes a person: correct, useless. Once you accept that the average is a lossy summary, the question of what a shorter climb has to do to hurt more than a longer one becomes tractable arithmetic rather than folklore.
What 1,840 Metres Over 25 km Actually Feels Like
Stelvio from Prato allo Stelvio starts at 908 metres and finishes at 2,748. That is 1,840 metres of vertical, more than any climb we hold profile data for in this piece. The road covers 25.04 kilometres, which means the mountain gives back a small amount of the effort in flat or false-flat sections and takes the rest through the tornanti above Trafoi. The reason Stelvio's number stays at 7.3 percent despite gradient signs quoting 12 and 14 percent on the hairpins is that the arithmetic mean is dragged down by the long, straighter approach through the valley floor.
Total elevation gain, in this context, is the honest metric. Metabolic cost — the total work done against gravity — scales with the mass of the rider plus bike multiplied by the vertical displacement. A rider at 75 kilograms with a 9-kilogram bike climbing 1,840 metres does roughly 84 kilograms times 9.81 metres per second squared times 1,840 metres of gravitational work, or approximately 1,515 kilojoules over the ascent. On Ventoux from Bédoin the same rider does 1,297 kilojoules. On Tourmalet from Luz, 1,157. Those are physics numbers, and they explain why fatigue at the summit of Stelvio is quantitatively different from fatigue at the summit of Tourmalet even when the average gradient is identical.
But — and this is where the folklore complains — those figures assume the rider survived the mountain in the first place. Metabolic total is only decisive if the peak gradient never exceeds the rider's sustainable output. The moment a ramp forces you above threshold, the model changes. You are no longer paying in kilojoules over a long ledger. You are paying in glycogen bursts and creatine phosphate deposits that empty in ninety seconds. This is the door through which a shorter, steeper climb walks in.
Stelvio's hairpin faces reach a published maximum of 14 percent per climbfinder.com. On the numbered tornanti above the treeline, the 14 percent slabs are interrupted every hundred metres or so by the outside of the next bend, which relaxes the gradient just enough for the effort to recover. Length gives the mountain the time to do its damage; the hairpin architecture prevents any single ramp from being long enough to break a trained rider outright. The pain is scheduled, distributed, and survivable. Anyone whose legs remember Stelvio remembers a very long test of pacing discipline, not a knife fight.
 Passo di Gavia
The print from this article · from €29.95
View the print →
Passo di Gavia
The print from this article · from €29.95
View the print →
Why the Bédoin Numbers Deceive on Paper
Ventoux from Bédoin: 21.51 kilometres, 1,575 metres of gain, 7.3 percent average, 12 percent published maximum. On paper it is a slightly shorter, slightly less punishing Stelvio. In practice it is the climb that riders most consistently describe as the one they underestimated.
The reason lives in the distribution. The first six kilometres to Saint-Estève sit around 4 to 5 percent — a warm-up that does not touch the 7.3 percent average. Which means the average is being held up by the kilometres that come after. From Saint-Estève to Chalet Reynard the road drives into the forest and does not relent. That middle segment, roughly ten kilometres of continuous climbing to the ski station, sits well above the summary number. On a climb whose average is 7.3 percent and whose first quarter is a false-flat, the middle half is arithmetically forced into the 9 to 10 percent range to make the ledger balance. There is no escape ramp, no bend to unload the legs, no downhill. Just a straight-ish tunnel of pine and heat.
The heat is not incidental. Bédoin sits at 317 metres of elevation. The forest sections rarely exceed 1,300 metres. In July, the ambient temperature at the base can run twelve to fifteen degrees Celsius warmer than at the summit, and the forest traps radiant heat against the road. A rider whose power output is capped by core temperature rather than by lactate — which describes most amateurs on any July afternoon — is climbing a mountain whose functional gradient is higher than 7.3 percent for reasons that never appear on an elevation profile.
The upper section, from Chalet Reynard through the lunar limestone to the observatory at 1,892 metres, then adds crosswind that at speed behaves like an additional gradient. None of that is folklore. It is what happens when a climb concentrates most of its vertical into a middle third that the average gradient is honour-bound to disguise.
The Gavia Problem: When 18 km Reads Like 8
Passo di Gavia from Ponte di Legno is the interesting case, because the summary numbers make it sound tamer than it is. Length: 18.42 kilometres. Gain: 1,366 metres. Average: 7.4 percent. Nothing in that row of numbers explains why Gavia sits in a separate mental category from Tourmalet, which is slightly longer, slightly steeper in absolute vertical, and averages a decimal less.
Two things do the explaining. First, the published maximum. Climbfinder.com lists Gavia's maximum gradient from Ponte di Legno at 16 percent — the highest of any climb in our grounding for this piece. Stelvio tops at 14, Ventoux and Tourmalet at 12. That four-point spread between Gavia's peak and Ventoux's peak is where the mountain earns its reputation. Sixteen percent for a sustained ramp is not a hairpin trick. It is a wall on the open road, and the profile data we work from does not massage that away.
Second, and this is the part the arithmetic almost never surfaces: altitude. Gavia starts at 1,244 metres. That is higher than the summits of every col in the Massif Central. By the time you turn a pedal on Gavia, you are already at a height where the standard atmosphere delivers roughly 87 percent of sea-level oxygen partial pressure. The climb finishes at 2,610 metres, where that figure has fallen to about 73 percent. Every watt costs more, and the cost is compounding for the entire eighteen kilometres.
This is the "reads like eight" effect. Riders who have done Gavia and Tourmalet in the same trip do not describe them as neighbours in difficulty. They describe Gavia as the shorter climb of the two, which contradicts the tape measure. The perception is right; the tape is measuring the wrong thing. Duration under stress at altitude is not comparable to the same duration under stress at 700 metres. And this is worth naming plainly: our profile data, drawn from OpenTopoData's SRTM 30-metre elevation model, will differ in the last decimal from a road-book measured by rolling wheel. The elevation model is honest about where the ramps are; the road book is honest about how many metres of pavement you actually rolled over. On a mountain like Gavia, both are useful; neither is complete.
 Passo dello Stelvio
The print from this article · from €29.95
View the print →
Passo dello Stelvio
The print from this article · from €29.95
View the print →
What a Sub-10 km Climb Has to Do to Match Them
Now the arithmetic that started this piece. If a climb under 10 kilometres wants to inflict more suffering than Stelvio, Ventoux, Tourmalet, or Gavia, we can specify — from the numbers alone — what it must do.
Match Stelvio's total vertical in half the distance and the average gradient has to double. 1,840 metres over 10,000 metres of road is 18.4 percent. No public road climb in Europe sustains 18 percent for ten straight kilometres. That door is closed by geometry. Which means a shorter climb cannot compete on total gravitational work. Stelvio wins the kilojoule ledger and no rearrangement of a sub-10 km profile changes that.
So the shorter climb has to compete on the other axis: peak instantaneous demand. Take Gavia's 16 percent published maximum. If a climb can sustain something in that neighbourhood — not for a hairpin, but for a kilometre or two of open road — the physiology flips. The rider is now above threshold not for a scheduled sixty seconds but for a continuous six or eight minutes. Glycogen depletes locally in the working muscle. Core temperature rises without the ventilation relief a shallower gradient provides at speed. The rider slows, which extends time-under-tension, which deepens the deficit. This is the mechanism by which a climb one-third the length of Stelvio can end a ride earlier.
The arithmetic gives us three conditions a sub-10 km climb has to meet to hurt more than the giants we measured. It has to hold an average gradient well above 10 percent — meaning gain-per-kilometre in the 100-to-140-metre range, which is roughly the density of Gavia's steepest continuous section stretched across the whole climb. It has to place its worst ramps late, so the effort finds a rider already deep into anaerobic debt rather than fresh at the base. And, ideally, it has to finish at altitude, because the same wattage costs more oxygen the higher the road goes.
Climbs that meet all three conditions exist in Europe. We did not measure them for this piece, and we will not name numbers we have not verified in our own profile pipeline. What we can say is that the average-gradient shorthand — the number every guidebook leads with — is the single least useful figure for predicting whether a climb under 10 kilometres will hurt more than one over 20. Length and average together tell you what the climb costs on the physics ledger. Peak gradient, ramp placement, and summit altitude tell you whether you get to pay that cost in instalments or in a single lump. A 25-kilometre mountain will always take more from you in total. A 9-kilometre mountain, structured correctly, will take it all in one afternoon.
This piece did three things and refused a fourth. It walked through the arithmetic of average gradient using the four climbs we hold measured profile data for: Stelvio from Prato, Ventoux from Bédoin, Tourmalet from Luz, and Gavia from Ponte di Legno. It explained why identical 7.3 percent averages describe non-identical mountains. It set out, from the numbers alone, what a sub-10 km climb would have to do to compete. It did not rank the famous short climbs — Angliru, Zoncolan, Mortirolo, Kitzbüheler Horn, Muro di Sormano — because our profile pipeline has not yet measured them and we do not publish numbers we have not measured. That analysis is a separate piece, waiting for the data.
FAQ
Why does the average gradient of Stelvio not tell me how hard the hairpins are?
Average gradient is total elevation gain divided by total length. On Stelvio from Prato, 1,840 metres over 25.04 kilometres gives 7.3 percent. That figure is mathematically dragged down by the long, straighter approach and dragged up by the tornanti above Trafoi. The published maximum is 14 percent per climbfinder.com. Any single ramp can sit far above or below the mean, and the mean by construction hides both.
How can Gavia and Tourmalet share almost the same average yet feel different?
Gavia averages 7.4 percent, Tourmalet 7.3, a difference of one decimal. The gap is elsewhere: Gavia's published maximum is 16 percent versus Tourmalet's 12, and Gavia starts at 1,244 metres and tops at 2,610, while Tourmalet from Luz-Saint-Sauveur starts at 709 and tops at 2,114. Higher peak gradient and higher summit altitude combine to make Gavia's per-kilometre cost non-comparable to Tourmalet's, even when the summaries agree.
Is there a public road climb under 10 km that matches Stelvio's total elevation gain?
No, not on the arithmetic. Stelvio from Prato gains 1,840 metres. To match that in under 10 kilometres, a road would need an average gradient of 18.4 percent or higher for its full length. Sustained gradients of that order do not exist on European paved climbs. A shorter climb can inflict more suffering per minute, but the total gravitational work stays with the longer mountain.
Why is altitude a factor if I ride at a moderate pace?
Standard atmosphere delivers roughly 87 percent of sea-level oxygen partial pressure at 1,244 metres, Gavia's base, and around 73 percent at 2,610 metres, its summit. Aerobic capacity degrades approximately in step. That penalty applies whether you are riding hard or moderately — it is a ceiling on the power your body can produce sustainably, not a tax on effort you choose to add. On a long high-altitude climb the penalty compounds for every kilometre you spend up there.
Where does the profile data in your articles come from?
Our climb profiles are sampled from the OpenTopoData SRTM 30-metre elevation model along the road geometry of each ascent. That is a satellite-derived elevation grid at 30-metre horizontal resolution. Where a maximum gradient is quoted as a published figure, we cite the source separately — for the four climbs in this piece, that source is climbfinder.com. Model-derived numbers and road-book numbers will not always agree in the last decimal; we prefer to name both.
Why does Mont Ventoux from Bédoin feel harder than its average suggests?
Because the average is distributed unevenly. The first six kilometres from Bédoin are false-flat around 4 to 5 percent, which forces the remaining fifteen kilometres to average well above 7.3 percent for the total to work out. The forest section from Saint-Estève to Chalet Reynard concentrates most of the mountain's difficulty into a straight, shaded, heat-trapping stretch with no hairpin relief. The number on the sign hides the shape.
Are your figures the same as what a Strava segment reports for these climbs?
Strava segment data is aggregated from GPS traces of riders and rounds elevation to whatever the device recorded, which varies widely by unit and firmware. Our figures are drawn from a single elevation model applied consistently across every profile we publish, so the four numbers in this piece are internally comparable. They will not match every Strava segment to the metre, and we do not claim they should.
Which sub-10 km climbs did you consider naming and why did you not?
The obvious candidates are Angliru, Zoncolan, Mortirolo, Kitzbüheler Horn, and Muro di Sormano — each cited routinely as harder per kilometre than the long giants. We did not name numbers for any of them in this piece because our profile pipeline has not yet ingested and verified their elevation data at the same standard we hold for Stelvio, Ventoux, Tourmalet, and Gavia. A dedicated piece will follow when the measurements do.
From the collection

New climbs and 10% off your first print.
One email now with your code. No noise after.