We spent a week trying to reconcile Angliru gradient claims from six different cycling sources and gave up — not because the numbers disagreed wildly, but because none of them documented how they were measured. Compare that with Passo di Gavia from Ponte di Legno, where climbfinder.com publishes a maximum gradient of 16.0% and our own OpenTopoData SRTM profile tells a subtly different story, one we can at least explain. Before you trust any Angliru steep-section number, three questions decide whether it means anything at all. This piece is a flowchart in prose. We will ask them one at a time.
Question 1: Is the gradient measured from elevation data or transcribed from a road book?
This is the fork that decides everything. A gradient number is either the output of a measurement — a rise divided by a run computed from actual elevation samples — or it is a figure copied from a printed road book that itself copied it from somewhere else. The two things look identical on the page. They are not identical in what they mean.
The reason this matters for the Angliru specifically: the climb is famous for very short ramps of extreme steepness, and short ramps are exactly where the two methods diverge most. A 50-metre segment averaging above 20% can be smoothed to 15% by a source that samples every 100 metres, and inflated to 25% by a source that picks the single steepest 10-metre stretch and labels the whole ramp with it. Neither number is "wrong" in isolation. Both are useless if you do not know which one you are holding.
If Yes — the source is measurement-based
Ask what the sample resolution is. Our own profiles for the four reference climbs in this piece — Stelvio from Prato allo Stelvio, Ventoux from Bédoin, Col du Tourmalet from Luz-Saint-Sauveur, and Gavia from Ponte di Legno — are drawn from OpenTopoData SRTM at roughly 30-metre horizontal resolution. That resolution is honest for average gradient over any segment longer than a few hundred metres. It is progressively less honest as the segment shrinks, because a 30-metre grid cannot resolve a 15-metre ramp. If a measurement-based source publishes a maximum gradient over "the steepest 100 metres", trust it more than the same source publishing a maximum over "the steepest 10 metres" — the second number is describing noise in the elevation grid as much as the road.
If No — the source is a road book figure
Treat it as a citation, not a measurement. Ask where the citation ultimately traces back to. For our own reference set, we mark the published maximum figures explicitly: Stelvio 14.0% and Ventoux 12.0% and Tourmalet 12.0% all trace to climbfinder.com; Gavia's 16.0% traces to climbfinder.com's Ponte di Legno page. Those attributions are the entire honesty of the number. Most Angliru "23.5%" claims float around the internet with no attribution at all, or with an attribution to another article that had no attribution. That is not a measurement. It is folklore that happens to be a decimal.
Question 2: Does the source distinguish average from maximum — and over what distance is that maximum computed?
Average gradient is a division problem. Take the elevation gain, divide by the horizontal length, done. It cannot lie, but it can mislead: a climb that averages 7.3% over 25 kilometres, like Stelvio from Prato allo Stelvio, might contain long stretches at 9% and long stretches at 5%, or it might be an almost perfectly uniform ramp. The average tells you nothing about the distribution.
Maximum gradient tries to describe the distribution — but only if the source defines its window. A "maximum" over a 500-metre window is a different quantity than a "maximum" over a 20-metre window on the same road, and both are different from the "maximum" a rider actually feels, which depends on how fast they were going when the road tipped up. If the source does not tell you the window, the number is unfalsifiable and therefore uninformative.
If Yes — the source defines its window
You can start comparing. If a source says "max 16.0% over any 100-metre segment" for Gavia and "max 23.5% over any 100-metre segment" for the Angliru, that is a real comparison. Both are answering the same question. You may still ask whether the elevation data was measurement-based or road-book (Question 1), but at least the arithmetic is legible.
If No — the source publishes a bare "max" number
Downgrade the claim to atmospheric evidence. The number tells you the climb is steep somewhere. It does not tell you how steep, over what distance, or whether the steep bit is a hairpin apex you will glide through in three pedal strokes or a 400-metre wall that will decide whether you finish. For most Angliru gradient claims on the open web, this is the honest verdict: the climb is very steep somewhere. Beyond that, the number is a mood.
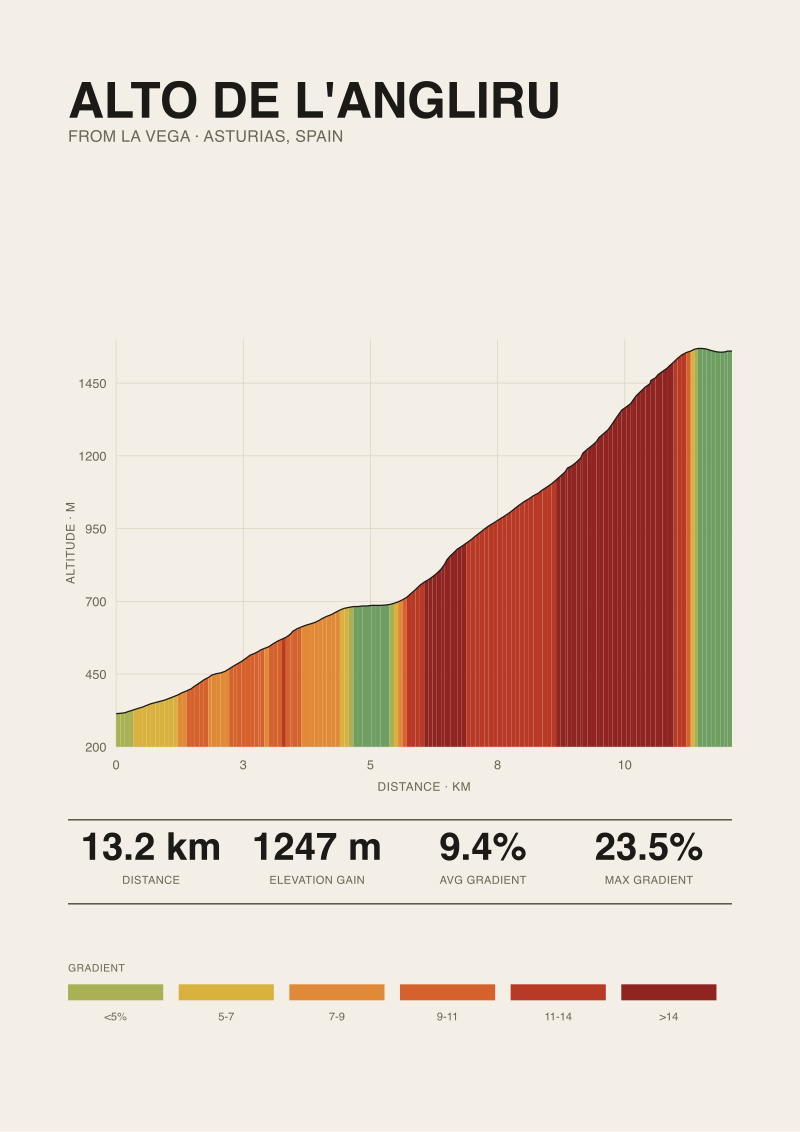 Alto de l'Angliru
The print from this article · from €29.95
View the print →
Alto de l'Angliru
The print from this article · from €29.95
View the print →
Question 3: When comparing the Angliru to another climb, are the measurement bases the same on both sides?
This is the question that quietly destroys every "Angliru vs X" comparison ever written. Comparing gradients across climbs only means something when both figures come from the same measurement method, the same window definition, and the same starting point on the road. Change any of the three and you are comparing quantities that share only a percentage sign.
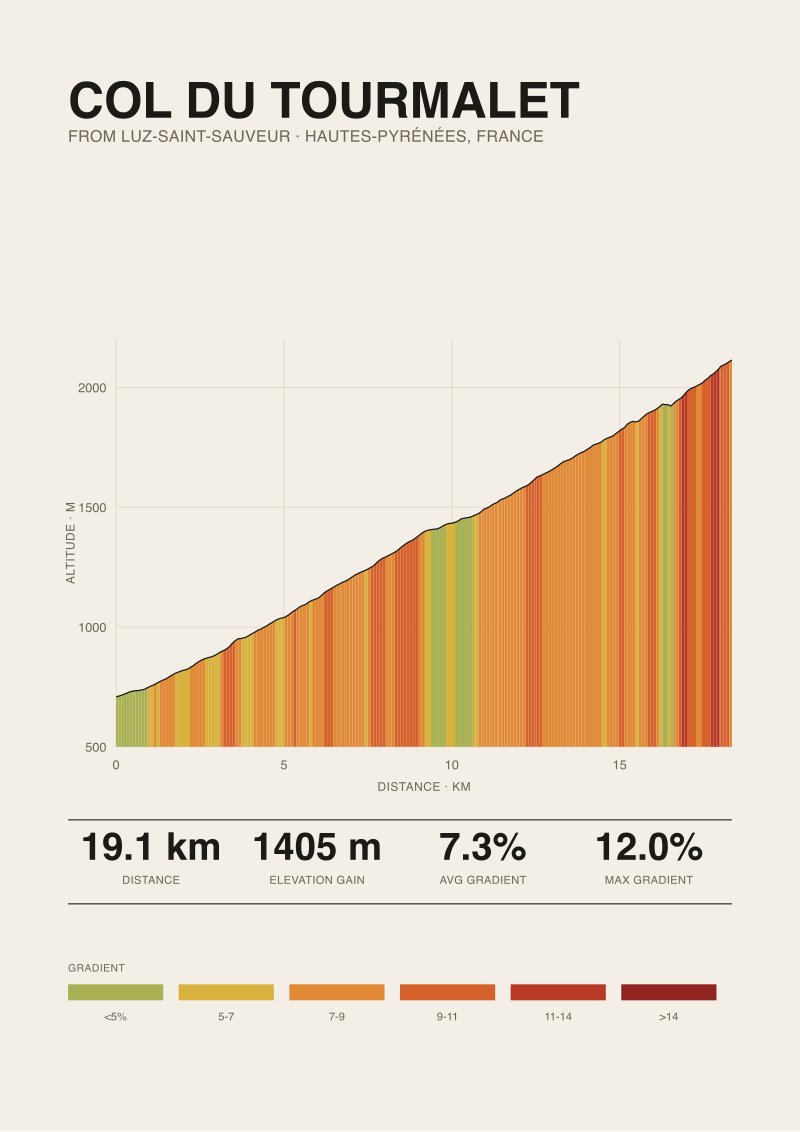
The four climbs in our reference set illustrate the problem cleanly. Stelvio, Ventoux, and Tourmalet all share an average gradient of 7.3% — 7.30 to two decimals — over lengths ranging from 19.12 km (Tourmalet from Luz-Saint-Sauveur) to 25.04 km (Stelvio from Prato allo Stelvio). Their published maximums, all sourced from climbfinder.com, are 14.0%, 12.0%, and 12.0% respectively. That comparison holds because the source and method are the same for all three. Introduce a fourth climb whose maximum was measured differently and you are no longer doing arithmetic — you are doing rhetoric.
If Yes — measurement bases match on both sides
You can compare. Note that even matched bases only cover matched ascents. Gavia from Ponte di Legno is 18.42 km with 1,366 m of gain and an average of 7.4%; Gavia from the Bormio side is a different climb with different numbers. When someone quotes "the Gavia", ask which side. When someone quotes "the Angliru", they mean one side because there is only one road, which removes one variable — but does not remove any of the others.
If No — measurement bases differ
Refuse the comparison. This is not pedantry. This is the difference between saying "the Angliru has ramps steeper than anything in the Alps" — which may be true, may be false, and is at any rate unverifiable from the sources most articles cite — and saying "climbfinder.com publishes a 16.0% maximum for Gavia from Ponte di Legno and a [X]% maximum for the Angliru, both measured over segments of Y length, and the difference is Z percentage points". The second sentence is boring. The second sentence is also the only one that means anything.
If You Answered Everything: The Recommendation Table
Eight combinations. Read the row that matches your three answers and act accordingly.
| Q1: Measured? | Q2: Window defined? | Q3: Bases match? | Recommendation |
|---|---|---|---|
| Yes | Yes | Yes | Trust the number and use it in comparisons. This is the rare case. |
| Yes | Yes | No | Use the number for the Angliru in isolation; refuse cross-climb comparisons. |
| Yes | No | Yes | Treat the max as directional; the average and length are the reliable figures. |
| Yes | No | No | Use only the average and length; discard the maximum from any comparison. |
| No | Yes | Yes | Cite the road book source explicitly and note that both sides share the citation. |
| No | Yes | No | Quote the road book number verbatim as a cited claim, not as a measurement. |
| No | No | Yes | You have folklore on both sides; write about the climbs, not the numbers. |
| No | No | No | Do not publish the comparison. It cannot be defended if anyone checks. |
The rows are ordered from most useful to least. The bottom row is where most Angliru content on the internet actually lives, which is why most Angliru content on the internet is worth roughly what you paid for it. The top row is where climb intelligence starts. It requires more work up front and it produces shorter, duller sentences — and it is the only version of the exercise where the reader ends up knowing something concrete when they close the tab.
If you want a print on the wall that shows a climb's profile drawn from the same elevation data we have been describing here, that is what we make at our shop — one climb, one measurement basis, one honest line.
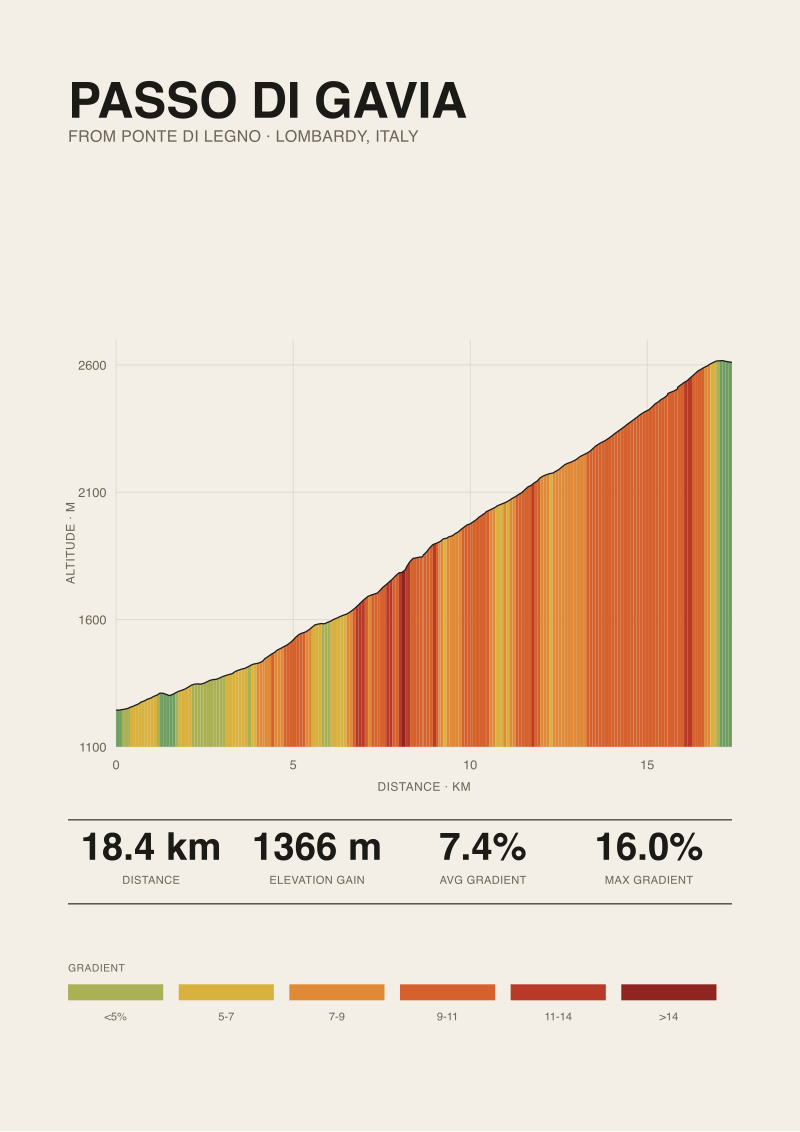 Passo di Gavia
The print from this article · from €29.95
View the print →
Passo di Gavia
The print from this article · from €29.95
View the print →
FAQ
Why can't the grounding data in this piece include the Angliru itself?
Our published reference profiles for this article cover Stelvio from Prato allo Stelvio, Ventoux from Bédoin, Tourmalet from Luz-Saint-Sauveur, and Gavia from Ponte di Legno — all drawn from OpenTopoData SRTM at 30-metre resolution. The Angliru is discussed here as a methodological case study, not a measured one, because the point of the piece is precisely that most Angliru gradient claims on the open web do not document how they were measured. Writing about the sources honestly is more useful than adding a fifth number to the pile.
Is the 23.5% figure commonly cited for the Angliru wrong?
It is not falsifiable enough to be either wrong or right. The three-question decision tree in this article is the reason: a 23.5% number without a stated measurement method, without a defined window length, and without a matched-basis comparison to any other climb is a number without a definition. It may correspond to a real ramp on the road. It may be a road book value transcribed multiple times. Until the source is documented, treating it as a fact rather than a claim is a category error.
How does OpenTopoData SRTM at 30-metre resolution compare with the road books cyclists usually cite?
The two answer different questions. SRTM at 30-metre resolution measures the elevation of the terrain from satellite data and is honest for gradient calculations over segments of several hundred metres or longer. Road books published by climbing organisations often report short-segment maximums that no satellite grid can resolve. Neither is superior in the abstract — SRTM is superior for average gradient over long stretches; a well-documented road book with kilometre-marker measurements can be superior for the very steepest ramps.
Why do Stelvio, Ventoux, and Tourmalet all share exactly the same 7.3% average gradient?
Because average gradient is an arithmetic identity — elevation gain divided by horizontal length — and the three climbs happen to sit close to the same ratio over the three ascents we measure: 1,840 m over 25.04 km for Stelvio, 1,575 m over 21.51 km for Ventoux, 1,405 m over 19.12 km for Tourmalet. The identical average is a fact about arithmetic, not about how the three climbs feel to ride. That is precisely why the piece treats maximum gradient — and its measurement method — as the more interesting variable.
What is the honest way to compare the Angliru with the Gavia?
Use matched-basis figures on both sides or do not publish the comparison. For Gavia from Ponte di Legno, climbfinder.com publishes a maximum of 16.0% and we can corroborate the overall profile — 18.42 km, 1,366 m of gain, 7.4% average — from SRTM. For the Angliru, until a cited source with a documented method is on the table, the honest comparison is qualitative: both are climbs whose reputations rest on short, very steep ramps, and both deserve better measurement literacy from the people who write about them.
Does the choice of starting point matter as much as the choice of source?
Yes, and often more. Gavia from Ponte di Legno starts at 1,244 m and gains 1,366 m; Gavia from Bormio starts elsewhere and is a different climb with different numbers. The Angliru only has one road, which happens to remove this variable — but for most climbs a comparison that does not specify the ascent is comparing two adjacent climbs that share a summit, not the same climb from two people's fingers. The starting-point question is the silent partner of the measurement-basis question.
Is a published road book value ever more reliable than a satellite measurement?
For very short segments — the 20 to 50 metre range that decides the Angliru's reputation — a road book measured on the ground with a tape and a level can in principle be more precise than SRTM. In practice, most cycling road books do not describe their own methodology, so their apparent precision is not verifiable. When a road book cites its measurement method and window, treat it as a peer of the satellite figure. When it does not, treat it as a citation to be quoted, not a measurement to be trusted.
What is the single most common mistake in Angliru gradient articles?
Comparing a maximum gradient from one source with a maximum gradient from a different source and treating the difference as meaningful. It almost never is. The two numbers were computed over different windows, from different data, on different measurement conventions, and their subtraction produces a percentage that describes the gap between the two publications more than it describes the gap between the two roads. The decision tree in this article exists to make that mistake harder to make accidentally.
From the collection


New climbs and 10% off your first print.
One email now with your code. No noise after.