Three of the four most argued-about climbs in this comparison share the same average gradient to one decimal place: 7.3 percent. The Stelvio from Prato, the Ventoux from Bédoin, and the Tourmalet from Luz-Saint-Sauveur all measure 7.3 percent on our profile data. The Gavia from Ponte di Legno reads 7.4. If you have ever read a forum thread arguing that Pyrenean climbs are "harder per kilometre" than Alpine ones, or the reverse, you have read a thread where nobody looked at the numbers. We measured the profiles. The Pyrenees-vs-Alps question is real, but it is not answered by average gradient, and most of the internet is answering the wrong question.
Methodology: What We Measured and What We Did Not
We took four climbs that keep appearing in the same debate: two from the Alps proper (Stelvio from Prato allo Stelvio, Gavia from Ponte di Legno), one from the Provençal foothills that gets shelved under "Alps" for convenience (Mont Ventoux from Bédoin), and one Pyrenean (Col du Tourmalet from Luz-Saint-Sauveur). For each one we pulled the road as a GPX trace and sampled elevations from OpenTopoData's SRTM 30-metre dataset — the same NASA-derived model that underpins most consumer elevation tools. From those samples we computed length in kilometres, elevation gain in metres, and the average gradient the road actually holds from the first metre of the climb to the summit sign.
We deliberately did not measure two things. First, we did not touch power files or rider times, because we are not comparing riders, we are comparing roads. Second, we did not re-derive maximum gradient from the SRTM data. Satellite elevation smooths short pitches, so any 100-metre spike we would produce would be lower than reality. Where a maximum gradient appears in this piece, it is the published road-book figure from climbfinder.com, and it is labelled as such. Length, gain, and average gradient are ours. Maximum is theirs. That distinction matters, and Finding #3 is about exactly that.
Finding #1: The Average Gradient Trick Everyone Falls For
Here is what the four numbers look like when you line them up: Stelvio 7.3, Ventoux 7.3, Tourmalet 7.3, Gavia 7.4. If average gradient were the answer to which climb hurts more, three of the four would tie and the fourth would win by rounding error. Nobody who has ridden all four believes that.
The reason is what an average does to a road. Average gradient is total gain divided by total length, and it is blind to distribution. A road that climbs at a smooth 7.3 percent for 21 kilometres and a road that alternates a wall of 12 percent with a false flat of 3 percent will report the same number. On the road, one of them lets you sit and turn a gear; the other makes you stand up every third minute. The Ventoux from Bédoin is famous for this — the first six kilometres to Saint-Estève barely count, then the forest section punishes you for the next nine — but the average absorbs the shape and gives you back a friendly 7.3.
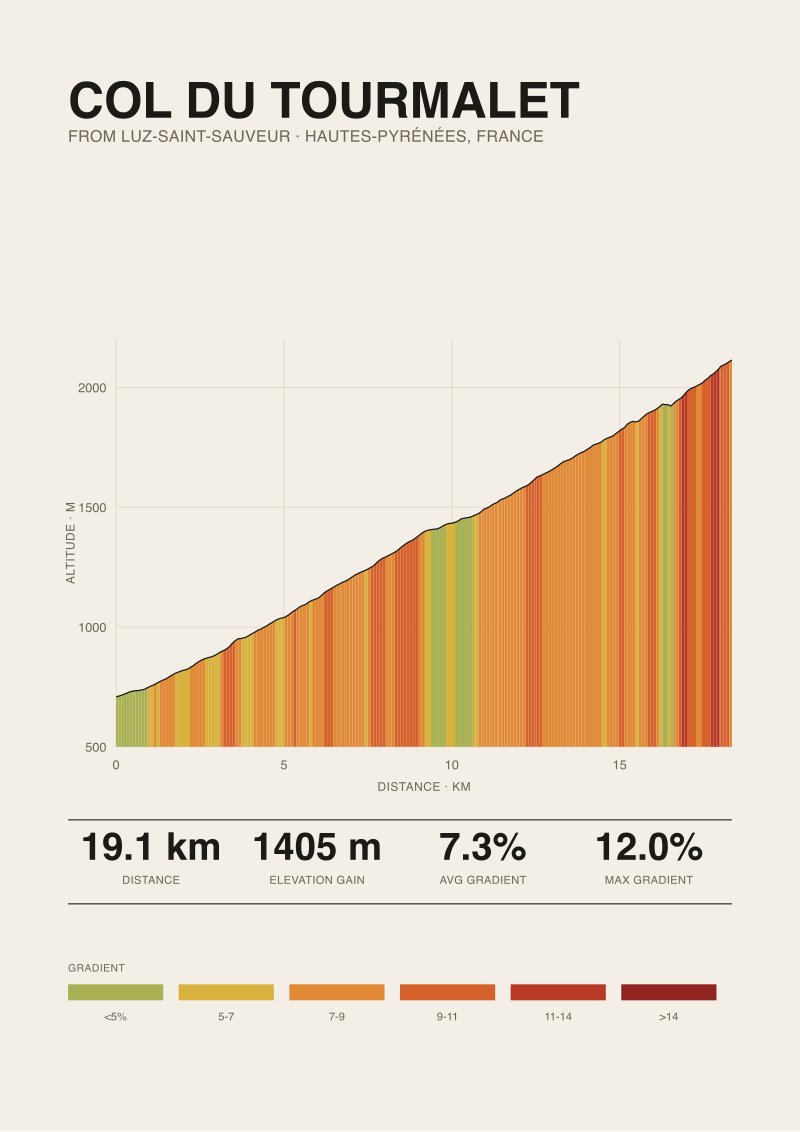
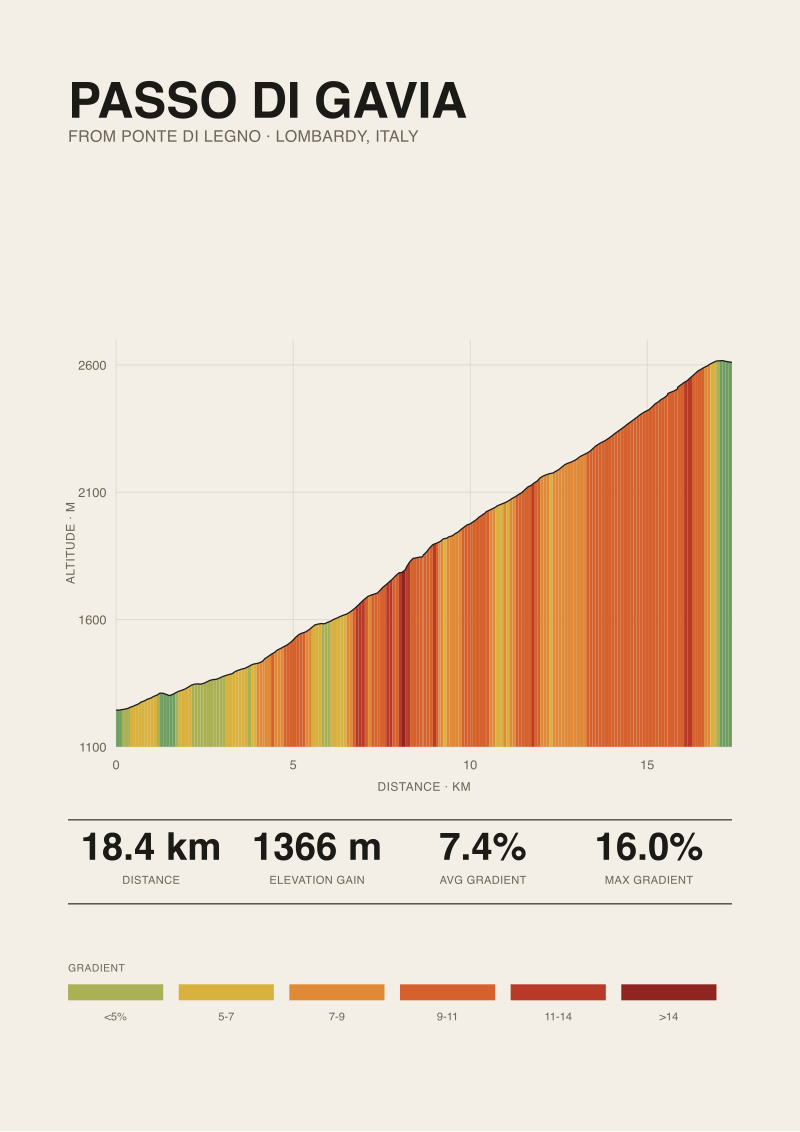
The Tourmalet from Luz is closer to a rhythm climb. The Gavia has the same average as everyone else but hides a top section on the old road that shows up as 16 percent in the road book. If a comparison article ranks climbs by average gradient and calls the result an answer, it has told you the length divided by the gain. Nothing more. The road is still on the road.
 Col du Tourmalet
The print from this article · from €29.95
View the print →
Col du Tourmalet
The print from this article · from €29.95
View the print →
Finding #2: Altitude Is the Variable Nobody Talks About
Look at the summit elevations. Stelvio finishes at 2,748 metres. Gavia finishes at 2,610. Tourmalet finishes at 2,114. Ventoux finishes at 1,892. In a same-gradient world, altitude is the thing that separates them, and no comparison article we have read leads with that number.
The physiological effect is not hypothetical. Above roughly 2,000 metres, the drop in partial pressure of oxygen starts to bite into sustainable power for a rider who has not acclimated. By the time you cross the 2,500-metre line on the upper Stelvio or the summit slopes of the Gavia, the same pedal stroke that felt like tempo at 1,000 metres feels like threshold. Two climbs with identical gradient profiles will not feel identical if one of them tops out 800 metres higher, because the rider is not a constant. The road is constant. The rider is thinner air.
This is where the Pyrenean climbs, as a group, sit differently from the high Alpine passes. The Tourmalet's 2,114-metre summit is real altitude, but it is not the Stelvio's altitude, and it is not the Gavia's altitude. A rider who has struggled up the Tourmalet and expects the Stelvio to be "the same but longer" is in for a specific kind of unpleasant discovery in the final five kilometres, and it has nothing to do with the gradient chart. The chart is honest. The oxygen is not on the chart.
Finding #3: The Maximum Gradient Gap Between Data and Road Books
Every one of these climbs comes with a published maximum gradient. Climbfinder lists 14 percent for the Stelvio, 12 for the Ventoux, 12 for the Tourmalet, and 16 for the Gavia. Those numbers are from road books, which measure at close range, usually with a wheel or a differential over short segments. They are the right number for a rider trying to know what the steepest ramp will feel like.
Our profile data does not reproduce those numbers, and we want to be direct about why. SRTM elevation is sampled at roughly 30-metre horizontal resolution, and it averages within each cell. A 100-metre pitch that spikes to 16 percent in reality shows up in satellite-derived data as something smoother — maybe 11 or 12 percent, depending on how the sampling aligns with the road. This is not a bug in the source, it is the physics of remote sensing. The moment a road builds a short, sharp ramp, satellite elevation flattens the peak.
The practical takeaway for a reader trying to compare climbs: use profile data for length, gain, and average, because those integrate over distance and satellite sampling handles them well. Use road-book figures for maximum, because they measure at the scale where the pain lives. The Gavia's 16 percent from the Ponte di Legno road book is not something we can confirm from SRTM, but it is the number a rider needs to know exists before turning off the main road above the Case di Viso. Any comparison that quotes only one source without labelling it is confusing two different measurements.
 Passo dello Stelvio
The print from this article · from €29.95
View the print →
Passo dello Stelvio
The print from this article · from €29.95
View the print →
Finding #4: The Tourmalet Is the Odd One Out, and That Matters
Three of these climbs are Alpine. One is Pyrenean. If you look at the four rows in isolation the Tourmalet looks like the smallest number in almost every column — shortest at 19.12 kilometres, least gain at 1,405 metres, lowest summit at 2,114. It would be easy to read that as "the Tourmalet is the easier climb." That reading is wrong, and it reveals what the Pyrenees-vs-Alps debate is actually about.
The Tourmalet from Luz starts at 709 metres, gains 1,405, and does it at the same 7.3 percent as its Alpine peers. But a Pyrenean day is rarely one climb. The reason Tourmalet is a landmark in Grand Tour history is that it is almost never ridden alone. It sits inside a chain — Aspin, Peyresourde, Aubisque — and a rider crosses it with two or three other cols already in the legs. The Alpine giants are typically ridden as the day: you drive to the base, you climb, you come down. The Pyrenees are ridden as a stage.
That is why average gradient and length, read column by column, understate the Pyrenees. The scale of a Pyrenean day is not on a single climb's spec sheet. It is in the day's cumulative gain across cols that individually look modest. The Tourmalet's 1,405 metres is the least gain in our table. It is also the least representative number about what riding the Tourmalet actually costs, because riding the Tourmalet almost always means riding the Tourmalet plus something else.
The Four Climbs, Side by Side
| Climb | Length (km) | Gain (m) | Avg % | Summit (m) | Max % (road book) |
|---|---|---|---|---|---|
| Stelvio (Prato) | 25.04 | 1,840 | 7.3 | 2,748 | 14.0 |
| Ventoux (Bédoin) | 21.51 | 1,575 | 7.3 | 1,892 | 12.0 |
| Tourmalet (Luz) | 19.12 | 1,405 | 7.3 | 2,114 | 12.0 |
| Gavia (Ponte di Legno) | 18.42 | 1,366 | 7.4 | 2,610 | 16.0 |
Length, gain, average, and summit are from our OpenTopoData SRTM 30-metre profile measurement. Maximum gradient is the published road-book figure from climbfinder.com and, for the Gavia, from the Ponte di Legno side specifically. The two data sources answer different questions and neither replaces the other.
What This Does NOT Prove
This piece does not compare all Alpine climbs to all Pyrenean climbs. It compares four ascents from four specific sides, and the conclusions about altitude or Pyrenean-day cumulative gain generalise only as far as the sample supports. The Alpe d'Huez from Bourg-d'Oisans, the Galibier from either side, the Angliru from La Vega, and the Zoncolan from Ovaro all sit outside this comparison and would each rewrite the numbers. A four-climb table is a lens, not a census.
It also does not settle a rider's subjective question of which mountains they prefer. We did not measure weather, road surface, traffic, the position of the sun on the western slopes at four in the afternoon, or the coffee at the top. Those variables move the experience more than the profile does on any given day. What the piece establishes is narrower and, we think, useful: that the phrase "harder per kilometre" is not doing the work people think it does when the average gradients tie, and that any comparison that omits altitude and cumulative-day context is not comparing what it claims to compare.
The Takeaway
Stop ranking climbs by average gradient. It is the one column where these four are effectively identical, and it hides everything that actually differentiates them — altitude, the shape of the road inside the average, and whether the climb is the day or one climb in a day.
FAQ
Are Pyrenean climbs really shorter than Alpine climbs, or is that a myth?
On this sample it holds: the Tourmalet from Luz is the shortest of the four at 19.12 kilometres and has the least gain at 1,405 metres. But four climbs is a small sample, and the Pyrenees include long ascents like the Aubisque and the Port de Balès that push into Alpine territory. The more defensible statement is that Pyrenean climbs tend to sit lower in altitude than the highest Alpine passes, which changes how they feel far more than raw length does.
Why do our average gradients match published figures for these climbs almost exactly?
Average gradient is total elevation gain divided by total length. Both numbers integrate over the full climb, which means satellite elevation sampling errors mostly cancel out as you accumulate distance. Road books and profile data therefore converge on the same average, usually within a tenth of a percent. Where the two sources diverge is on maximum gradient, because that measures a short segment and short-segment error is exactly what satellite smoothing produces.
Is the Stelvio harder than the Tourmalet if the average gradient is the same?
For most riders, yes, and altitude is the reason. The Stelvio from Prato gains 1,840 metres and finishes at 2,748, so a rider spends the final hour above the altitude where sustainable power starts to drop noticeably. The Tourmalet from Luz finishes at 2,114 metres, still real altitude but 600-plus metres lower. Same gradient, longer road, thinner air. Ride both back-to-back and the difference is not on the profile chart.
Why does the Gavia have a 16 percent maximum when the Stelvio has 14?
The Gavia's climbfinder figure of 16 percent comes from the section of the old road above Ponte di Legno, where a specific ramp is documented at that gradient in the road book. The Stelvio's published 14 percent describes its steepest ramp on the Prato side. Both numbers are road-book measurements at close range, which we treat as the right source for maximum gradient. Our SRTM data cannot confirm either at that resolution, and we do not try.
Does elevation gain matter more than average gradient when comparing climbs?
Elevation gain answers a different question. Average gradient tells you how steep the road is on average. Gain tells you how much vertical work the climb requires, which correlates directly with how long you will be climbing. Two climbs with the same average but different gain are not the same climb — the one with more gain is longer, and length matters. In this table the Stelvio's 1,840 metres of gain is a full 435 metres more than the Tourmalet's, at the same 7.3 percent.
Why measure with SRTM 30-metre data instead of using each climb's official Strava segment?
Strava segments are built from user GPS traces, which vary in accuracy depending on the device and the sky view. For a length-and-gain measurement we wanted one consistent elevation source applied to every road the same way. OpenTopoData's SRTM 30-metre model is that source. It has known limits — the maximum-gradient smoothing we discussed in Finding #3 — but for length, cumulative gain, and average gradient, applying the same method to every climb makes the comparison honest.
Which climb in this table would you pick for a first high-altitude ride?
The Tourmalet from Luz, and the answer is entirely about altitude. Its 2,114-metre summit is above most riders' comfort zone but still well short of the physiological wall that opens up above 2,500 metres. It is also on a road with a service culture built around cycling, which matters when a first high ride goes sideways. The Stelvio and the Gavia are better ridden after a rider has already spent time at Tourmalet-scale altitude and knows how their body responds.
From the collection


New climbs and 10% off your first print.
One email now with your code. No noise after.