We have read a lot of articles ranking the hardest cycling climbs in Europe by gradient. They tend to agree on the shortlist — Stelvio, Ventoux, Tourmalet, Gavia, then a few others — and then produce a table with a percentage next to each name, sorted highest to lowest. The problem is not the list. The problem is that the number they sort by is doing almost none of the work they want it to do, and the pieces that follow the table repeat the same three or four mistakes in nearly the same order.
We measure these climbs before we draw them. Elevation data comes off a real profile, kilometre by kilometre. From that seat, gradient rankings read like restaurant guides that only publish the average price of the menu. Useful in a very narrow way. Actively misleading in most others. What follows is what the conventional coverage keeps getting wrong, what it never gets around to saying at all, and what we would tell a rider who actually wants to understand why one climb hurts more than another.
What They All Get Wrong
The dominant error is treating average gradient as a ranking scalar. Take three of the most cited climbs on the continent: the Stelvio from Prato allo Stelvio, Mont Ventoux from Bédoin, and the Col du Tourmalet from Luz-Saint-Sauveur. Our profile data has all three at 7.3 percent average. Ranked by gradient, they are indistinguishable. Ridden, they are three different mountains. The Stelvio is 25.04 kilometres and 1,840 metres of gain, starting at 908 metres. Ventoux is 21.51 kilometres and 1,575 metres from 317. Tourmalet is 19.12 kilometres and 1,405 metres from 709. Same average, three different bodies of work — and altitude, length, and where you finish all change what 7.3 percent feels like on a specific day.
The second mistake sits next to the first. Rankings that use maximum gradient as a tiebreaker almost never say where that maximum came from. Our grounding distinguishes the profile data we measured from the maximum gradient figures published in road books. The Gavia's climbfinder-published maximum is 16 percent from Ponte di Legno. Stelvio's is 14. Ventoux and Tourmalet, 12. These are useful figures — they represent the steepest short stretch a rider will actually meet on the road — but they are a different measurement basis from the average, and they belong to a different source. Copy-pasting them into a table sorted by average gradient produces a chart where the columns are not comparable, and no one flags it.
The third mistake is defining a climb without naming the ascent. There is no such thing as "the Stelvio" in the singular. Prato allo Stelvio, Bormio, and the Umbrail Pass are three separate climbs to the same summit, and they behave differently. Any ranking that lists "Stelvio — 7.3 percent" without a side identifier is asking the reader to accept a fiction. The convention on Ventoux is looser because Bédoin is treated as the default, but the Malaucène and Sault approaches exist, and they also have profiles that behave nothing like each other.
The fourth mistake is decorative language. "Legendary," "brutal," "epic" — these words survive because rankings are cheap to write and superlatives are cheap to reach for. They read as filler to anyone who has spent an hour on the Gavia above 2,300 metres. A serious ranking of hard climbs should treat those adjectives the way a decent atlas treats them: not at all.
What Is Almost Always Missing
Altitude never shows up. This is remarkable. The Gavia summits at 2,610 metres. The Stelvio, at 2,748. These are altitudes where the air stops cooperating and heart rates drift up for the same effort. A ranking that sorts the Gavia (max altitude 2,610 m) alongside Ventoux (max altitude 1,892 m) purely on gradient percent is comparing hours of work in different atmospheres. The last 500 metres of Stelvio are not the same 500 metres you would get at the bottom of Ventoux. Nothing on a gradient scoreboard tells you this.
The start elevation is treated as trivia when it is often the story. Gavia begins at 1,244 metres from Ponte di Legno — the rider is already above the summit of many respectable climbs before the first kilometre. Tourmalet from Luz-Saint-Sauveur starts at 709. Ventoux from Bédoin starts at 317, which means the rider covers a larger climate range than either of the Italian pair, from Provençal heat to alpine cold in under 22 kilometres. Rankings never carry this because rankings are one-dimensional.
The measurement basis is almost never disclosed. Our profile data here comes from OpenTopoData's SRTM 30-metre elevation model. Published road-book figures — the 16 percent on the Gavia, the 14 on the Stelvio — come from independent measurements, sometimes on-road GPS, sometimes older survey work. These sources will disagree at the extremes. Neither is wrong; they are answering different questions. Any ranking that stacks them without a footnote is asking the reader to compare a satellite average with a road-book peak and expect the comparison to mean something.
The distribution of gradient inside the climb is missing. Two 20-kilometre climbs at 7 percent average behave differently if one climbs steadily and the other alternates 4-percent valleys with 11-percent walls. This is not a subtle distinction — it changes the gear the rider chooses, the pacing, the failure mode. A single-number ranking cannot express it. A profile drawing can.
Finally, weather and season. The Gavia has a documented history of closing to snow well into June. The Stelvio's altitude puts it in the same category. Ventoux, at less than 1,900 metres, is rideable across a much wider window. A ranking of "hardest" climbs that never mentions when the road is actually open is a ranking of climbs half of the readers cannot access when they read it.
 Passo dello Stelvio
The print from this article · from €29.95
View the print →
Passo dello Stelvio
The print from this article · from €29.95
View the print →
What I Would Say Instead
Stop ranking. Start reading the profile.
The frame we use at the studio — the same one we draw our climb prints from — is simple, and it survives contact with real climbs. Five variables, in this order: length, elevation gain, average gradient, summit altitude, and where the steep sections sit inside the climb. Each of the four climbs we have profile data for tells its own story once you look at all five together.
The Stelvio from Prato is 25.04 kilometres, 1,840 metres of gain, 7.3 percent average, summiting at 2,748 metres, with a published maximum of 14 percent. What that combination says: this is a length-and-altitude climb. It will not surprise the rider with a wall. It will grind. The last third is above 2,000 metres, and that is where the day is decided.
Mont Ventoux from Bédoin is 21.51 kilometres, 1,575 metres, 7.3 percent, summiting at 1,892 metres, published maximum 12 percent. Same average as Stelvio, four kilometres shorter, 856 metres lower at the top. The story here is climate, not altitude — the forest section shelters the rider, the bald limestone above Chalet Reynard exposes them. Gradient does not describe that transition. The profile does.
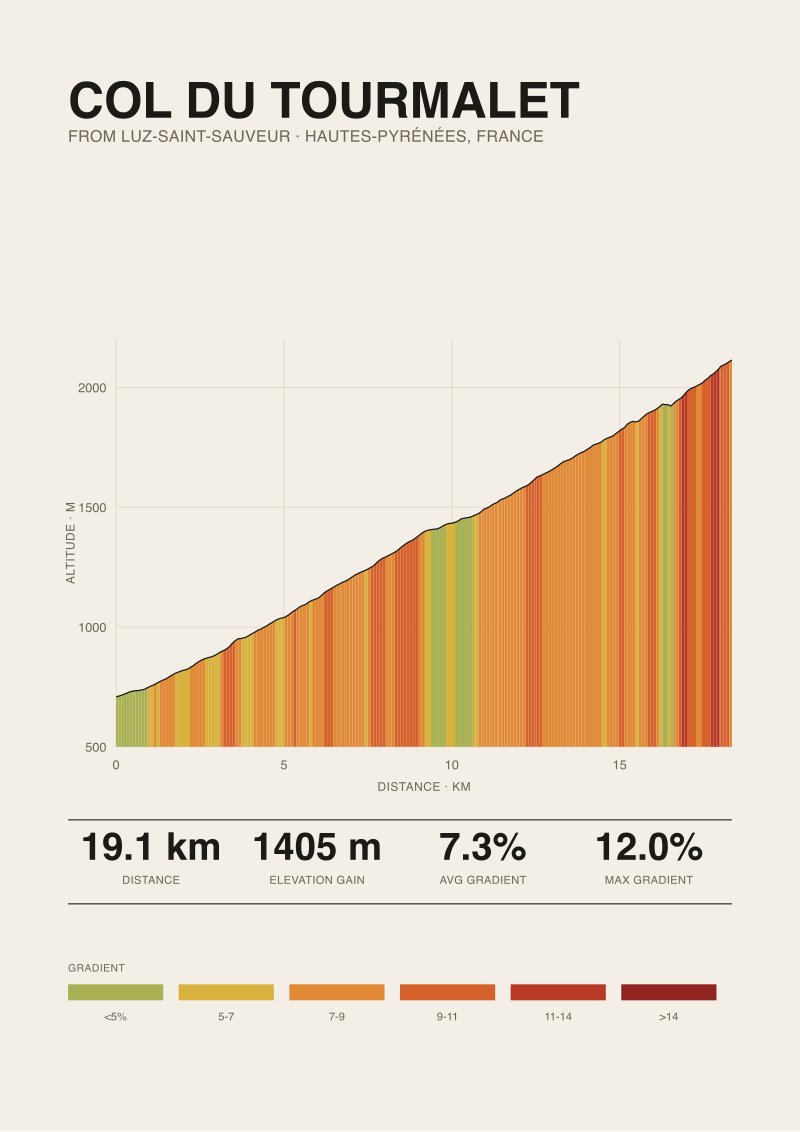
The Col du Tourmalet from Luz-Saint-Sauveur is 19.12 kilometres, 1,405 metres, 7.3 percent, summit at 2,114 metres, published maximum 12 percent. Shortest of the three at the same average, mid-range altitude. In practical terms, the most rideable of them for someone new to European alpine and Pyrenean climbing — enough length to matter, not enough altitude to punish, no wall gradients beyond what the average already suggests.
The Gavia from Ponte di Legno is the outlier. 18.42 kilometres, 1,366 metres, 7.4 percent average, summit at 2,610 metres, published maximum 16 percent. Shorter than the other three, similar gain, marginally higher average, but the published maximum is the highest of the four and the summit is second only to Stelvio. This is a distribution climb. The suffering is packaged into steep sections that do not show up in the average. Sorting the Gavia into a gradient ranking by its 7.4 percent and telling the reader it is a fraction harder than a 7.3 is wrong on the ground.
None of this decides which climb is "hardest." That question is badly posed. A better question — one the profile lets you answer — is which climb you should ride first, and in what order the others make sense afterwards. That question is where the real work of planning a European climbing trip starts, and it is not one that any gradient ranking can answer for you.
FAQ
Why do so many rankings put these climbs at the same average gradient?
Because the average is a division: total elevation gain over total length. Stelvio (1,840 m over 25.04 km), Ventoux (1,575 m over 21.51 km), and Tourmalet (1,405 m over 19.12 km) all reduce to 7.3 percent. That match is a coincidence of scale, not a statement of similarity. Two climbs can hit the same average with entirely different profiles, altitudes, and steep-section distributions.
Is maximum gradient a better ranking metric than average?
Not on its own. Published maximum figures — 16 percent for the Gavia from Ponte di Legno, 14 for Stelvio from Prato, 12 for both Ventoux from Bédoin and Tourmalet from Luz-Saint-Sauveur — describe a short stretch, sometimes only a few hundred metres. That number matters when it lands late in a long climb, but a ranking that sorts by maximum alone tells you nothing about how long the rider spends near that figure.
Does altitude actually change how hard a climb feels?
Yes, above roughly 2,000 metres it changes measurably. The last third of the Stelvio (summit 2,748 m) and the upper Gavia (summit 2,610 m) both spend time in air where power output falls for the same perceived effort. Ventoux (summit 1,892 m) never crosses that threshold. Any comparison that ignores altitude is comparing different physiological demands as if they were the same day of work.
What does "elevation data source" mean and why does it matter?
Our profile figures come from OpenTopoData's SRTM 30-metre elevation model — satellite-derived, consistent across every climb we measure. Published road-book maximums typically come from independent road measurements. The two are answering different questions. Mixing them in one table without disclosing the source is how rankings end up telling the reader that a satellite average and a road-book peak are comparable numbers. They are not.
Are shorter climbs automatically easier than longer ones?
No. The Gavia is 18.42 km, shorter than the Stelvio's 25.04 km, but its published 16 percent maximum, distribution of steep sections, and 2,610 m summit put it in a heavier category of work than length alone suggests. Shorter climbs concentrate the effort. A short climb with a wall is not a lighter day than a longer climb at a gentler average — it is a different kind of day, with different failure modes.
When are each of these four climbs actually rideable?
Ventoux from Bédoin, with a summit under 1,900 m, has the widest window — roughly April through October in most years. Tourmalet, at 2,114 m, is typically open May through October. Stelvio and Gavia, both above 2,600 m, are the shortest windows and depend on snow — often June through September, and even that can compress in a bad year. Any ranking that treats them as year-round options is misleading its reader.
Should a rider prioritise gradient or elevation gain when picking a first European climb?
Neither, at first. Prioritise length combined with summit altitude. Tourmalet from Luz-Saint-Sauveur — 19.12 km, 1,405 m of gain, 7.3 percent average, summit at 2,114 m — is a reasonable first serious European climb because the altitude is manageable and the profile does not hide surprises. Stelvio and Gavia are better second or third trips, once altitude tolerance is a known quantity rather than a guess.
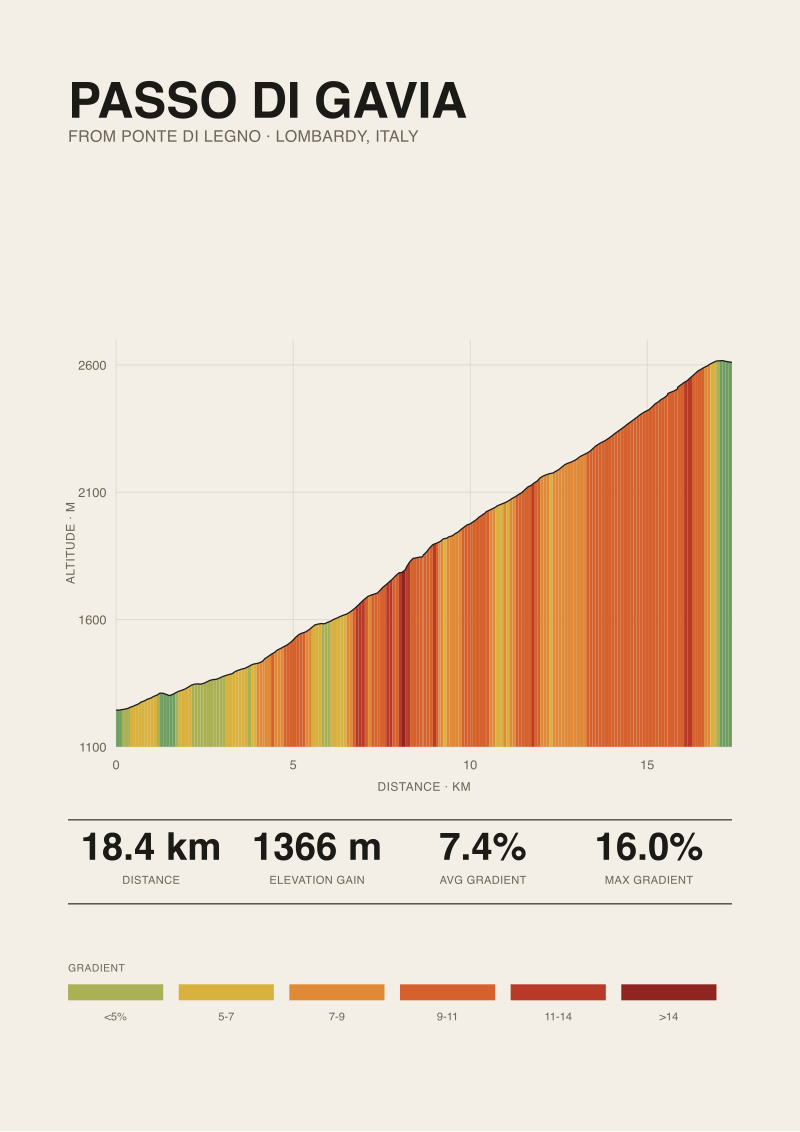 Passo di Gavia
The print from this article · from €29.95
View the print →
Passo di Gavia
The print from this article · from €29.95
View the print →
From the collection


New climbs and 10% off your first print.
One email now with your code. No noise after.