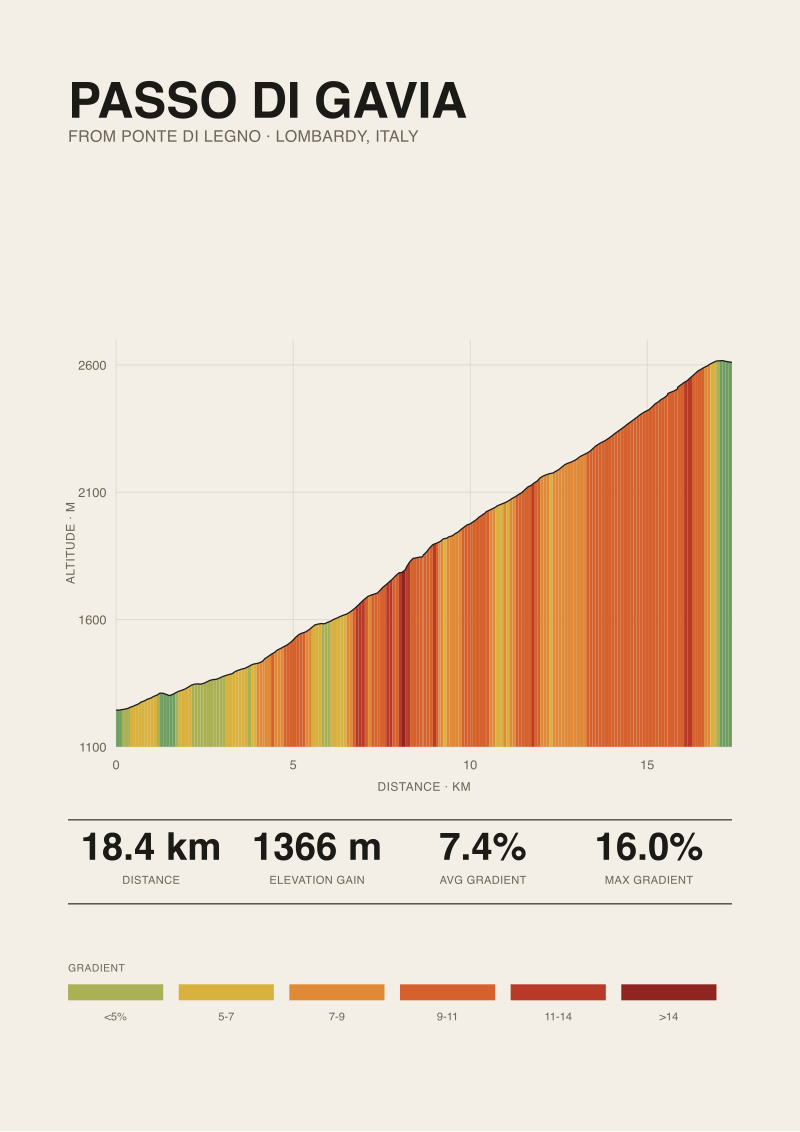
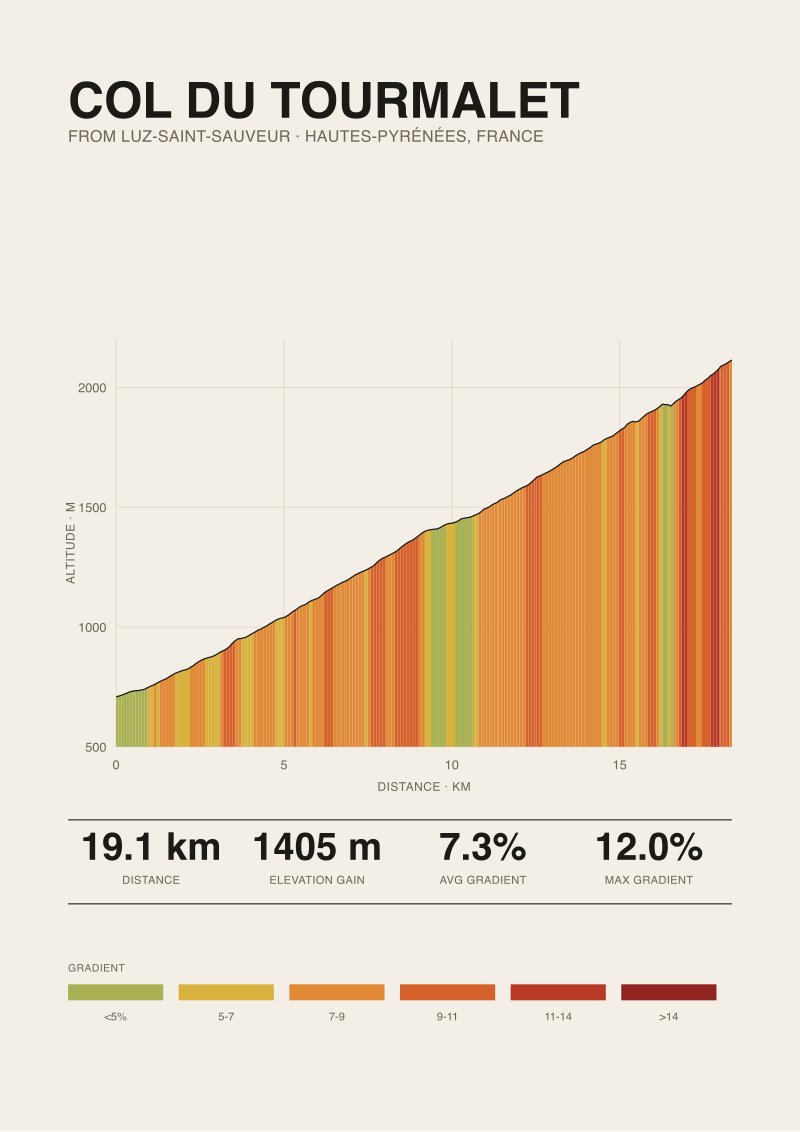
Four of Europe's most cited climbs — Stelvio from Prato allo Stelvio, Ventoux from Bédoin, Tourmalet from Luz-Saint-Sauveur, Gavia from Ponte di Legno — all average 7.3 or 7.4 percent over their measured length. On paper the same climb, four times. On the road, four completely different mountains: 25.04 km against 18.42 km, 1840 metres of gain against 1366, published maximum gradients ranging from 12 to 16 percent depending on the source. The gap between what an elevation profile displays and what a rider will feel is where most trip planning goes wrong. Reading a profile properly is a three-question exercise, and this desk runs it every time a print gets drawn.
Question 1: Is the profile measured or published?
Before you interpret any number on a climb profile, the first task is to know where the number came from. There are two families of figures in circulation, and they do not always agree.
Measured figures come from sampling elevation along the road at fixed intervals. This desk uses OpenTopoData against the SRTM 30-metre dataset, which means an elevation point every roughly 30 metres of horizontal distance. The length, elevation gain, average gradient, and start and summit altitudes we quote for Stelvio, Ventoux, Tourmalet and Gavia are all derived that way. They are reproducible: run the same coordinates through the same dataset and you get the same numbers.
Published figures come from road books, tourist offices, cycling clubs, and community sites like climbfinder. They are usually anchored to physical signage and local convention. A road-book maximum gradient is often the steepest number the observer measured over a very short section — sometimes ten metres of road, sometimes a single hairpin exit — and the observation methodology is rarely stated.
If the profile is measured
Trust the length, gain, average, and elevation range. These numbers are consistent internally. When we say Ventoux from Bédoin is 21.51 km with 1575 metres of gain and averages 7.3 percent, all three numbers are the same underlying arithmetic (gain divided by length equals average), and they were computed against a public dataset anyone can query.
What a measured profile does badly is short spikes. A 30-metre sample interval smooths over ramps shorter than that. If a wall is 40 metres of 15 percent between two flatter sections, SRTM will read it as maybe 9 or 10 percent. This is not the dataset lying — it is the resolution being honest about what it can see.
If the profile is published
Use it exactly where road books earn their keep: warnings about specific ramps, hairpins, altitude landmarks, and the local shorthand riders and organisers actually use. Climbfinder lists Stelvio's maximum gradient at 14 percent, Gavia from Ponte di Legno at 16 percent, Ventoux and Tourmalet at 12 percent. Those are useful numbers precisely because they concentrate on the sharpest sections, which measured averages dilute.
But do not treat a published maximum as comparable across climbs unless the methodology is stated. A 16 percent claim from one source and a 14 percent from another may reflect different measurement bases, not different mountains.
Question 2: Is the average gradient hiding the shape of the climb?
The four climbs above all sit at 7.3 or 7.4 percent average. The average is a single number that erases everything interesting about the road. Reading the profile is the process of putting that information back.
Start with the range the average has to cover. Stelvio ascends 1840 metres over 25.04 km. Gavia ascends 1366 metres over 18.42 km. Both average about the same gradient, but Stelvio asks for 33 percent more vertical work over a length that is 36 percent longer. The averages happen to converge; the day does not.
Then look at where the climb starts. Ventoux from Bédoin begins at 317 metres, a valley-floor departure, and finishes at 1892 metres. Gavia from Ponte di Legno begins at 1244 metres — higher than Ventoux ends — and tops out at 2610 metres. Same average gradient, entirely different atmospheric context. Ventoux is a climb about heat as much as it is about slope; the top thousand metres are exposed limestone with no shade and often no wind protection. Gavia is a climb where the summit sits above the treeline in air noticeably thinner than the start.
If the average matches the climb's shape
This is the rare climb: a road that grinds at close to its average for most of its length, with modest variance. Tourmalet from Luz-Saint-Sauveur, at 19.12 km and 1405 metres of gain averaging 7.3 percent, is closer to this than the others in the set. It has hard sections but does not stack them into a single wall. A rider whose sustainable effort matches 7.3 percent for two hours can hold something close to a steady tempo. The average is a fair predictor of the day.
If the average masks a bimodal profile
This is the more common case. Ventoux's average is diluted by the first 5 to 6 km through Bédoin's forest, where gradients sit in a manageable range, before the road tips into the middle section that has made the mountain a cliché. Two-thirds of the vertical work happens in the second half. A rider who paces to 7.3 percent from the town square will detonate in the forest exit.
Stelvio behaves differently again. The 25.04 km distance carries you through more than 40 hairpins that repeatedly break rhythm. The averaged 7.3 percent is closer to what the road actually delivers section by section than on Ventoux, but the sheer duration — over 1800 metres of gain in one continuous ascent — turns the middle hours into an aerobic problem the average cannot describe.
 Mont Ventoux
The print from this article · from €29.95
View the print →
Mont Ventoux
The print from this article · from €29.95
View the print →
Question 3: Where in the climb do the hardest ramps actually live?
Once you know the average is misleading and by roughly how much, the next question is where in the profile the punishment concentrates. Every published maximum in our set — Stelvio 14, Ventoux 12, Tourmalet 12, Gavia 16 — sits in a specific location on the climb, and that location decides the day.
Front-loaded ramps are the least dangerous. They arrive when legs are fresh, they can be pedalled through on adrenaline, and the recovery comes on the easier terrain above. Middle-loaded ramps are worse. They arrive after the rider has already committed to the climb but still has most of the vertical work ahead, and they eat glycogen at the worst possible time. Back-loaded ramps are the classic trap: a rider paces the average successfully for an hour, then finds a wall in the last 3 km when there is no reserve left.
If the hardest sections are near the base
Pace conservatively from the start and expect the profile to relent. Ventoux's Bédoin ascent does not do this — the forest section is not the hardest part — but climbs with cliffs near the base tend to reward a slow start more than the average suggests.
If the hardest sections are stacked in the middle
This is the reason a 12 percent published maximum on Ventoux and a 12 percent on Tourmalet do not describe equivalent days. The Ventoux middle section, roughly from Saint-Estève to Chalet Reynard, holds double-digit ramps for kilometres, not metres. The Tourmalet has hard sections but does not concentrate them the same way. Pacing here means treating the average as a floor for the flatter parts and a ceiling for the harder ones, and accepting that the middle will feel out of proportion to the numbers on the profile.
If the hardest sections are near the summit
This is the Gavia problem in miniature. Ponte di Legno to the summit is 18.42 km, and the published 16 percent maximum on climbfinder is not evenly distributed across those kilometres — it sits in the sections above the tree line, where thin air compounds the gradient. A rider who arrives at the last 5 km with legs already at threshold has no answer for a 16 percent ramp at 2400 metres of altitude. This is where the gap between measured average and lived experience is widest.
If You Answered Everything: the recap table
The three questions map onto eight possible answer combinations. Each combination points to a different way of reading the profile you have in front of you.
| Q1: Measured or Published? | Q2: Average matches shape? | Q3: Where do the hardest ramps live? | Recommendation |
|---|---|---|---|
| Measured | Yes | Base | Trust the average, start conservatively, plan for a steady tempo above the ramps. |
| Measured | Yes | Middle | Trust the length and gain; pace the middle by feel, not by the average number. |
| Measured | Yes | Summit | Reserve capacity for the top third; the average will underestimate the last kilometres. |
| Measured | No (bimodal) | Base | Ignore the average entirely; treat the climb as two separate efforts stacked. |
| Measured | No (bimodal) | Middle | This is the Ventoux pattern; pace by section, not by the summary number. |
| Measured | No (bimodal) | Summit | This is the Gavia pattern; the average is a decoy, the top is the climb. |
| Published only | Uncertain | Uncertain | Use published data for warnings and landmarks; do not compare maxima across sources. |
| Published only | Uncertain | Known local reputation | Trust local knowledge over the summary figures; road books exist because averages fail. |
The table is deliberately reductive — real climbs shade between categories — but the discipline it enforces is the point. Every profile can be interrogated with these three questions, and the recommendation follows from the answers rather than from whatever the summary panel happens to display.
 Passo di Gavia
The print from this article · from €29.95
View the print →
Passo di Gavia
The print from this article · from €29.95
View the print →
What the three questions leave out
The method above covers what the profile can tell you. It does not cover what the mountain does independent of gradient. Altitude is the first omission: Gavia's summit at 2610 metres and Stelvio's at 2748 asks for output at air pressure the profile does not depict. Weather is the second: the Ventoux summit ridge is exposed to the mistral in a way that the elevation curve does not record. Road surface is the third: some of these roads are impeccable, others patched, and none of that appears in an SRTM sample.
The three questions also leave out the rider. A profile is neutral information. What makes a climb hard for a specific person on a specific day is the interaction between the profile, the atmosphere, the equipment, and the legs that arrived at the base. This desk measures before it draws because the geometry is the part we can be honest about. The rest is the reader's problem, and no elevation graph is going to solve it for them.
None of this tells you which climb belongs on your wall. That question is where the shop starts, and it is not where this piece ends.
FAQ
How accurate are elevation profiles built from SRTM 30-metre data?
Accurate within about 1 to 3 metres vertically per sample point over open terrain, and consistent within a few percent when integrated into total elevation gain. The known limitation is horizontal resolution: sections shorter than about 30 metres of road get smoothed. A 40-metre wall at 15 percent will read closer to 10 percent in the sampled data. For length, total gain, and average gradient the numbers are reliable; for maximum gradient over very short sections, road books and local signage remain more accurate.
Why do published maximum gradients vary so much between sources?
Because there is no shared definition. A 14 percent claim might describe the steepest 10 metres of road, the steepest 100 metres, or the steepest single hairpin exit. Climbfinder's Stelvio figure of 14 percent and its Gavia from Ponte di Legno figure of 16 percent are internally consistent, but comparing either against a figure from a different source assumes both used the same measurement window. That assumption is usually wrong. Trust maxima within a single source; be sceptical across sources.
Why do climbs with identical average gradients feel completely different?
Because the average erases distribution, length, and altitude. Stelvio and Gavia both average around 7.3 percent, but Stelvio is 25.04 km with 1840 metres of gain starting at 908 metres, while Gavia is 18.42 km with 1366 metres starting at 1244 metres. Stelvio is a longer day at lower altitude; Gavia is shorter but tops out at 2610 metres. The average is a summary of arithmetic, not a summary of what the road asks the rider to do.
Is the average gradient useful at all, then?
Yes, as a floor. If a climb averages 7.3 percent, no interpretation of the profile will make it easier than 7.3 percent overall. What the average cannot do is predict how the effort distributes. Use it to set expectations for total work — length times average gradient gives you a first estimate of vertical metres — and then use the profile shape to figure out where in the climb that work concentrates.
How does altitude change how a profile should be read?
Above roughly 2000 metres, atmospheric pressure drops enough to reduce sustainable power output for most riders, and the reduction compounds toward the summit. Gavia's last kilometres above 2400 metres and Stelvio's above 2500 are not just steeper problems on paper; they are the same gradient with less oxygen. A profile does not display atmospheric pressure. When a summit sits above 2000 metres, treat the top third as harder than the graph shows.
What does an elevation profile leave out that riders should know?
Wind exposure, road surface, shade, and gradient spikes shorter than the sample resolution. Ventoux's summit ridge is famously exposed to the mistral in a way no profile records. Some Alpine passes have been repaved recently, others have not, and the difference is measured in watts. Very short ramps between hairpins may be steeper than the smoothed profile suggests. The elevation profile answers the geometric question. The rest is local knowledge.
How should the three-question method change for a climb I have never seen?
It should not. The point of the method is that the same three questions work on any climb whose profile you can find. Establish where the numbers come from, ask whether the average describes the shape, and locate the hardest sections in the ascent. A climb you have ridden before adds intuition; a climb you have not ridden yet is exactly the case the method was designed for. The profile does not know you, and it does not need to.
From the collection


New climbs and 10% off your first print.
One email now with your code. No noise after.