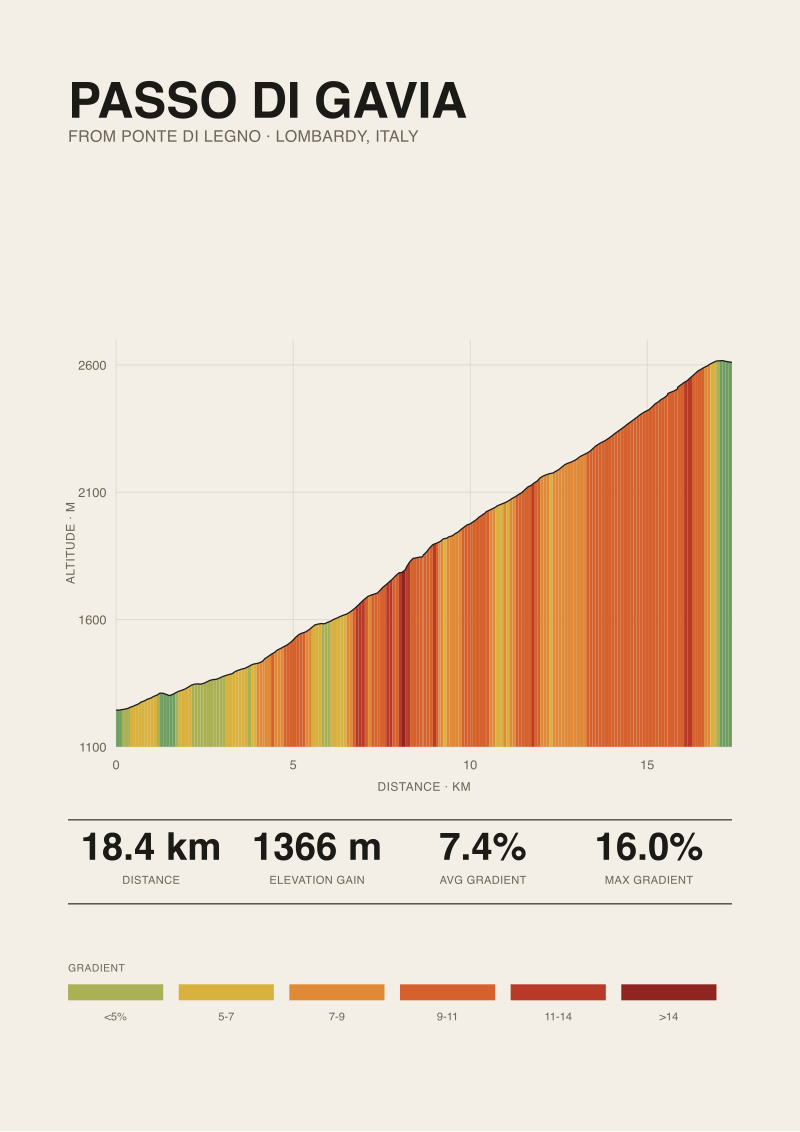
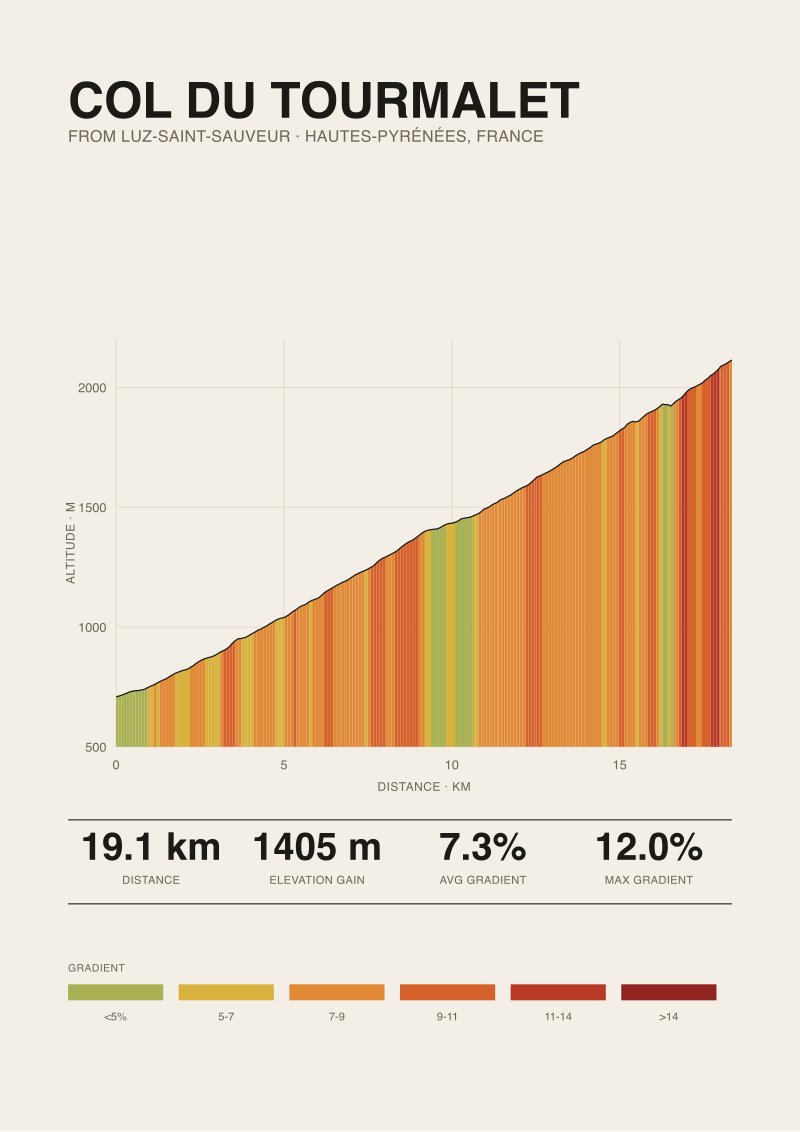
25.04 kilometres. 1,840 metres of vertical gain. 7.3% average gradient. Those three numbers, pulled from OpenTopoData's SRTM 30-metre elevation model for the Prato allo Stelvio ascent, are the receipt we keep coming back to when readers ask why the Stelvio's reputation outruns its arithmetic. The published maximum gradient sits at 14%, per climbfinder.com. Every other climb in our current index — Ventoux from Bédoin, Tourmalet from Luz-Saint-Sauveur, Gavia from Ponte di Legno — averages within a tenth of a percent of the Stelvio. So what, exactly, are the 48 hairpins doing to a climb that reads, on paper, like any other 7.3% road?
What the Elevation Data Says About Prato allo Stelvio
The measured ascent begins at 908 metres above sea level in Prato allo Stelvio and finishes at 2,748 metres at the pass. That is 1,840 metres of vertical gain across 25.04 kilometres of road, and the arithmetic is exactly what it looks like: 1,840 divided by 25,040 gives 7.35%, which rounds to the 7.3% we quote. There is no trick in the average. It is a genuinely long climb sustained at a genuinely mid-range gradient.
The elevation model behind these numbers is OpenTopoData's SRTM 30-metre grid — satellite radar data resampled onto a 30-metre horizontal cell. It is the same source that produces every other length and gain figure in our index, which matters when we compare climbs against each other. If we measured the Stelvio one way and the Tourmalet another, any comparison would be noise. Everything in this article rides on the same measurement basis.
What the SRTM data does not tell us directly is how the 1,840 metres is distributed along the road. An average gradient is a single number squeezed out of thousands of small ones. The climb from Prato allo Stelvio does not spend 25 kilometres at 7.3%. It spends time above that figure and time below it, and the distribution is what makes the Stelvio the Stelvio rather than a longer Tourmalet.
Compare it against the neighbours in our index and the resemblance in the headline number becomes striking. Ventoux from Bédoin: 21.51 kilometres, 1,575 metres of gain, 7.3% average. Tourmalet from Luz-Saint-Sauveur: 19.12 kilometres, 1,405 metres, 7.3% average. Gavia from Ponte di Legno: 18.42 kilometres, 1,366 metres, 7.4% average. Four legendary Alpine and Pyrenean ascents sitting inside a tenth of a percent of each other on average gradient. If gradient averages decided reputations, none of these climbs would be more famous than the others.
The Stelvio's separator is length and altitude, not slope. It is longer by roughly 3.5 kilometres than Ventoux, by nearly 6 kilometres than Tourmalet, by 6.5 kilometres than Gavia. It finishes 856 metres higher than Ventoux, 634 metres higher than Tourmalet, 138 metres higher than Gavia. The 908-metre start elevation is the lowest of the four, meaning the rider absorbs the full 1,840-metre altitude swing rather than starting halfway up like on the Gavia from Ponte di Legno at 1,244 metres. The climb is not steep. It is tall.
What Nobody Mentions About the 14% Figure
The published maximum gradient for the Prato allo Stelvio ascent is 14%, cited by climbfinder.com and repeated across the road-book ecosystem. That figure sits alongside 16% on the Gavia from Ponte di Legno and 12% on both Ventoux and Tourmalet. Read as a comparison, the Stelvio's maximum is unremarkable. There are climbs in our own index with steeper reported pitches.
Here is what the road-book number is doing that the SRTM data cannot verify. A published maximum gradient is measured over some segment of road — typically a hundred metres, sometimes less — using a survey wheel, a professional bike computer, or an official cadastral chart. It captures peaks of steepness that a 30-metre satellite grid physically cannot see. If a 14% pitch lasts only 40 metres before easing, our elevation model averages it into a milder cell. That is why we distinguish, always, between our measured average and the road book's published maximum. They answer different questions.
For the Stelvio specifically, the 14% number attaches to individual hairpin insides. The road engineers who cut the Prato allo Stelvio ascent used tornante (switchback) geometry to keep the outer arc of each hairpin ridable, but the inner line — the shorter path a rider takes when cornering tight — accelerates the gradient locally. A hairpin measured wheel-to-wheel on the inside can hit percentages the road as a whole never approaches. Riders feel this immediately. The straights between hairpins are notionally the "average" gradient of the climb; the hairpins themselves are the maximums.
There is a second thing the 14% figure obscures. The Stelvio has 48 numbered hairpins on the Prato allo Stelvio side — the famous switchback count that gives this article its keyword. A 48-hairpin ascent means the road is bending back on itself, on average, every 522 metres. That density is the point. It is not that any individual hairpin is exceptionally steep by Alpine standards. It is that the rider encounters a 14%-ish local pitch every 500 metres, for 25 kilometres, at increasing altitude. The maximum gradient is not an outlier. It is a rhythm.
We would not claim, from SRTM data alone, that the 14% figure is precisely correct. Climbfinder.com's number is the reference we cite, and it aligns with what riders report. Our contribution is the average, the length, the gain, and the honest reminder that satellite elevation and road-book survey data measure the climb at different resolutions and answer different questions. Both are useful. Neither is complete on its own.
 Passo dello Stelvio
The print from this article · from €29.95
View the print →
Passo dello Stelvio
The print from this article · from €29.95
View the print →
The Real Cost of Averaging 7.3% Over 25 Kilometres
The mistake we see readers make, over and over, is treating the 7.3% average as a workload description. It is not. It is a summary statistic. What the ride actually costs is the interaction between that average, the 25.04-kilometre length, and the 2,748-metre summit altitude, and each of those three ingredients does damage the others cannot.
Take gradient first. A steady 7.3% on flat power is a mid-tempo effort for a trained cyclist — sustainable, uncomfortable, but not catastrophic. Ride it for twenty minutes on a shorter climb and the number describes the experience honestly. The Stelvio is not a twenty-minute effort. At the pace of a competent amateur — call it 10 to 12 kilometres per hour on gradient like this — the Prato allo Stelvio ascent is a two-hour to two-and-a-half-hour climb. Sustained 7.3% for two hours is a different physiological event than sustained 7.3% for twenty minutes, even though the average gradient is identical. Duration compounds average.
Then add the altitude cost. The climb starts at 908 metres and finishes at 2,748 metres. That upper third — everything above roughly 2,000 metres — is where air density drops meaningfully enough that untrained lowland riders feel it in their power output. The literature on altitude-adjusted performance is well established: above 2,000 metres, aerobic capacity begins to decline noticeably, and by 2,700 metres the effect is significant even for acclimatised athletes. The Stelvio's final six or seven kilometres, in other words, are ridden at reduced power for reasons that have nothing to do with the gradient printed on the profile. The last hairpins are the same 7.3%-ish as the middle hairpins. They cost more because the rider costs more.
Now put the hairpins on top of that. Forty-eight of them, spread across 25 kilometres, means the ride is never rhythmic in the way a Tourmalet or a Ventoux can be. On Ventoux from Bédoin the forest section is a long straight grind at gradients between 8% and 10%; the rider finds a cadence and holds it. On the Stelvio, the cadence is broken every 500 metres by a switchback that spikes the gradient briefly, forces a line choice between the mild outside and the steep inside, and demands a small out-of-saddle effort to restart momentum on the exit. Multiply that micro-effort by 48. The 14% published maximum is not a single event you survive. It is a tax you pay 48 times.
The real cost of averaging 7.3% over 25 kilometres, then, is that "7.3%" describes almost nothing about how the climb actually rides. The number is accurate. It is also, on its own, misleading. Length converts a manageable gradient into a duration event. Altitude converts a duration event into a power-loss event. Hairpin density converts a duration-plus-altitude event into a rhythm event. The Stelvio's reputation is the sum of those three multipliers, not the average that appears on the road sign.
This is also why the Stelvio ends up in our shop more often than any other climb we render. A profile print of the Prato allo Stelvio ascent — the 25.04 kilometres unfolded flat, the 48 hairpins marked, the 908-to-2,748-metre altitude swing rendered vertically — is a portrait of a climb that a single number cannot describe. If that is the wall you want, it is at see the Passo dello Stelvio print.
If You Only Remember One Thing
The Stelvio from Prato allo Stelvio is a 7.3% climb that does not ride like a 7.3% climb, because 25.04 kilometres, 1,840 metres of vertical, a 2,748-metre summit, and 48 hairpins are four separate multipliers acting on that average simultaneously.
The road-book 14% maximum is a hairpin figure, not a sustained pitch. Our SRTM measurement gives you the shape of the whole climb; the 14% gives you the character of every switchback. Both are true. Neither, alone, tells you why riders remember this road above every other 7.3% average in our index.
The next question the profile raises, which this article deliberately does not answer, is what the Stelvio's other two ascents — from Bormio and from Santa Maria in Switzerland — actually measure, and whether the Prato allo Stelvio reputation survives when you put all three side by side on the same elevation model. That comparison is where the interesting arguments start. It is not where this piece ends.
 Mont Ventoux
The print from this article · from €29.95
View the print →
Mont Ventoux
The print from this article · from €29.95
View the print →
FAQ
How long is the Stelvio Pass from Prato allo Stelvio?
The Prato allo Stelvio ascent measures 25.04 kilometres from a start elevation of 908 metres to the 2,748-metre summit, per OpenTopoData's SRTM 30-metre elevation model. That makes it the longest climb in our current index by a clear margin — roughly 3.5 kilometres longer than Ventoux from Bédoin and nearly 6 kilometres longer than Tourmalet from Luz-Saint-Sauveur. Length, not gradient, is the Stelvio's structural signature.
What is the average gradient of the Stelvio from Prato allo Stelvio?
The measured average gradient is 7.3%, calculated from 1,840 metres of vertical gain across 25.04 kilometres of road. That figure sits within a tenth of a percent of Ventoux from Bédoin (7.3%), Tourmalet from Luz-Saint-Sauveur (7.3%), and Gavia from Ponte di Legno (7.4%). What separates the Stelvio is not the average — it is the interaction between that average, the total length, and the summit altitude.
What is the maximum gradient on the Stelvio Pass?
The published maximum gradient is 14%, per climbfinder.com. That figure is a road-book number surveyed over short segments, typically at the inside line of individual hairpins, and it captures pitches too brief for a 30-metre satellite elevation grid to resolve. Our SRTM-based measurement cannot verify a 14% peak directly; it can only confirm the overall shape. Both figures are useful, and they answer different questions about the climb.
Why does the Stelvio have 48 hairpins?
The 48 numbered hairpins are how the road engineers absorbed 1,840 metres of vertical gain across 25 kilometres of mountainside without the road itself exceeding sustainable gradients. Switchback geometry lets a climb hold roughly 7.3% over its length by trading directional efficiency for gradient management. The trade-off is that the rider encounters a locally steeper pitch — up to the published 14% — every 500 metres or so, which shapes the rhythm of the climb far more than the average number suggests.
Is the Stelvio harder than Mont Ventoux?
On measured averages, no — both climb at 7.3%. On total workload, yes. The Prato allo Stelvio ascent is 25.04 kilometres versus Ventoux's 21.51 from Bédoin, gains 1,840 metres versus Ventoux's 1,575, and finishes at 2,748 metres versus Ventoux's 1,892. The Stelvio is the longer, taller effort by any measure. Ventoux is a fiercer sustained pitch in its forest section; the Stelvio is a longer aerobic and altitude event.
Does altitude actually affect performance on the Stelvio?
Yes, meaningfully, in the upper portion. The climb starts at 908 metres, which is essentially lowland riding, but the final six to seven kilometres cross into altitudes above 2,000 metres where air density begins to reduce aerobic power output. By the summit at 2,748 metres, the physiological cost of a given gradient is noticeably higher than the same gradient at sea level. The last hairpins are not steeper than the earlier ones. They are more expensive.
How does the Stelvio compare to the Gavia in the same region?
Both are Italian Alpine passes with similar average gradients — Gavia averages 7.4% from Ponte di Legno versus the Stelvio's 7.3% from Prato allo Stelvio. The Gavia is shorter (18.42 kilometres versus 25.04), gains less vertical (1,366 metres versus 1,840), and starts far higher (1,244 metres versus 908). Gavia's published maximum is also higher at 16% versus the Stelvio's 14%. In practice, the Gavia is a steeper, shorter, higher-starting climb; the Stelvio is a longer, taller endurance event.
Where does the elevation data in this article come from?
Every length, gain, average gradient, and altitude figure quoted here for the Stelvio, Ventoux, Tourmalet, and Gavia is measured from OpenTopoData's SRTM 30-metre elevation model — satellite radar data resampled onto a 30-metre horizontal grid. The published maximum gradient (14% for the Stelvio) is cited from climbfinder.com, which uses road-book survey data. We keep the two sources labelled separately because they measure the road at different resolutions and are not directly comparable.
From the collection

New climbs and 10% off your first print.
One email now with your code. No noise after.