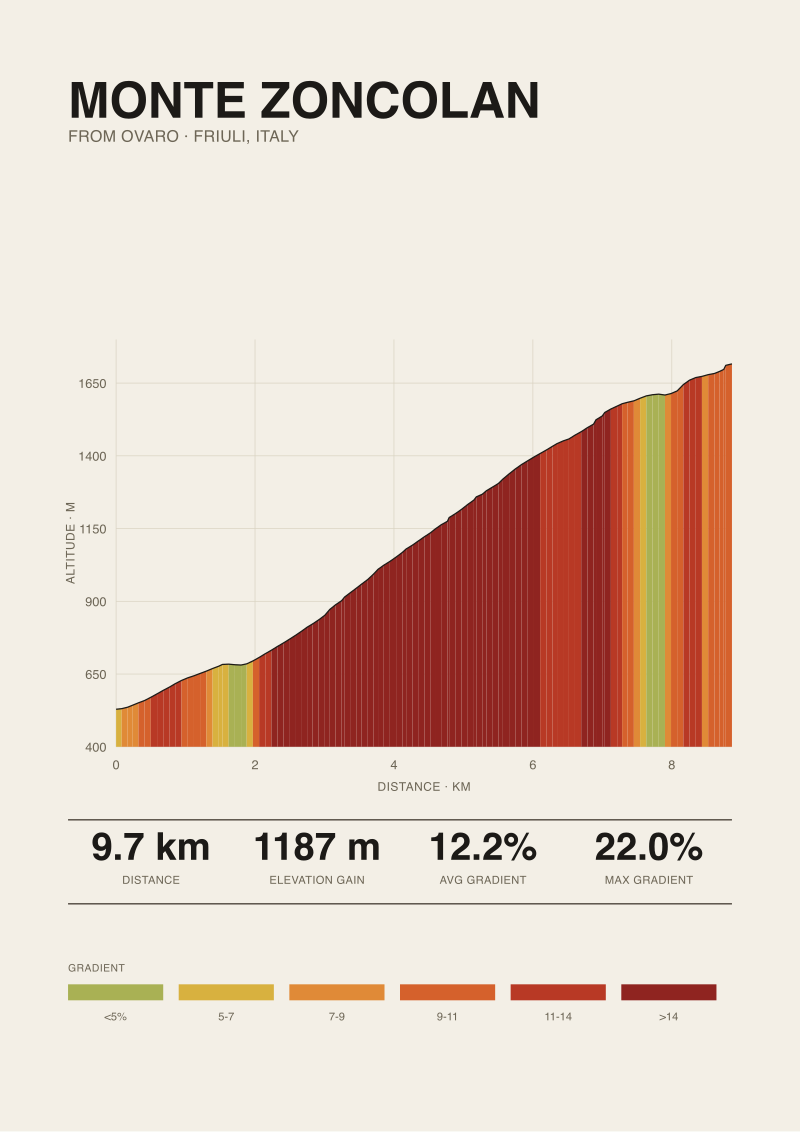
Monte Zoncolan from Ovaro measures 9.74 kilometres with 1,187 metres of elevation gain — a 12.2 percent average that puts it among the steepest paved climbs any Grand Tour peloton is asked to ride. Written that way, it sounds like a settled figure. It is not.
The average hides more than it reveals. An average of 12.2 percent means, by definition, that half of the road is steeper than 12.2 percent, and on this specific mountain, "steeper" reaches a published maximum of 22 percent on the Giro road book. This piece reads the Ovaro profile the way we read every climb before we draw it: measured, with the honest gaps flagged where they exist.
What Do the Numbers Actually Say About the Ovaro Ascent?
The measured profile is short and brutal. From the road at Ovaro (529 metres) to the summit at 1,716 metres, the road climbs 1,187 metres over 9.74 kilometres. That is a 12.2 percent average gradient — a figure that stops mattering once you accept what averages do to lumpy terrain.
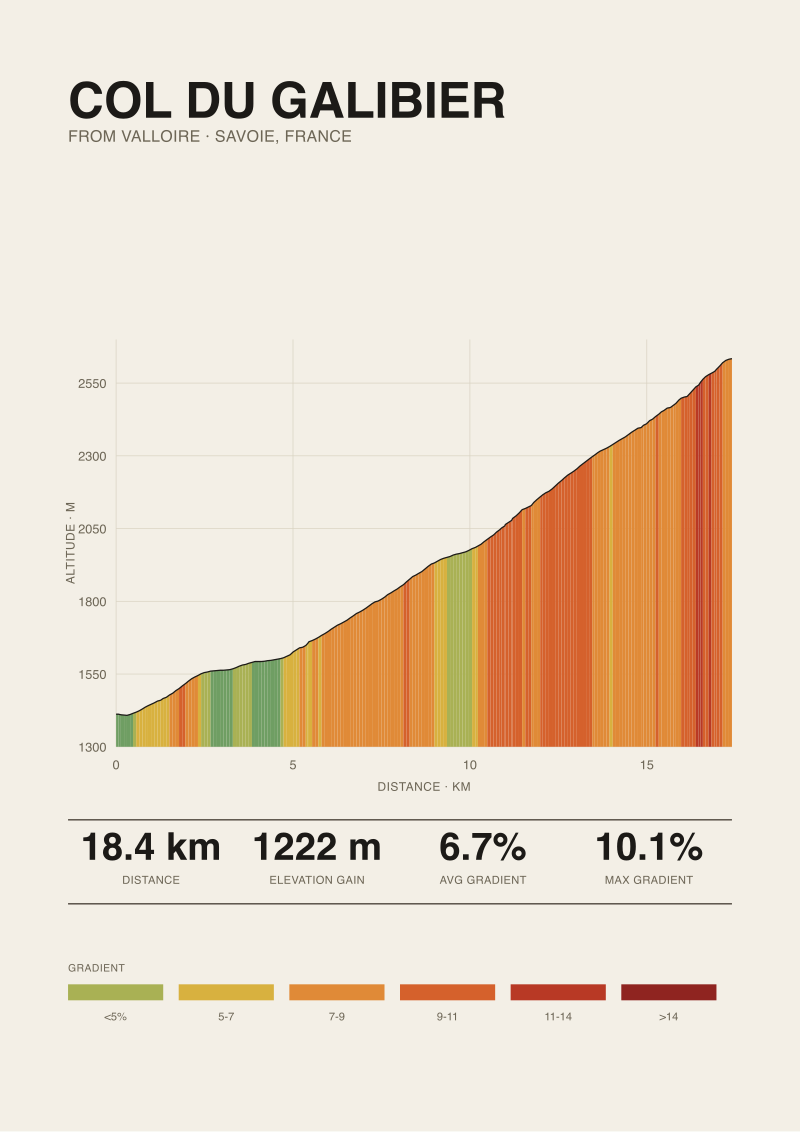
For comparison to the reader's mental map: a typical Alpine pass like the Galibier from Valloire sits closer to a 7 percent average over similar length. Zoncolan from Ovaro is roughly 1.7 times steeper on the mean, in the same rough distance envelope. The vertical gain per kilometre is 122 metres — a number worth writing out, because it makes the arithmetic hard to argue with. That density of gain per kilometre is what puts this climb into a category of maybe four or five paved roads in Europe.
Why Does 12.2 Percent Average Feel Understated on Zoncolan?
Because it isn't a wall. It's a saw. A 12.2 percent average over 9.74 kilometres could describe a road that maintains something close to 12.2 percent the whole way — miserable, uniform, honest. Zoncolan from Ovaro isn't that road. The published maximum of 22 percent tells you the distribution is skewed: the steepest sections cluster tightly, and the arithmetic forces the "average" section to sit well below the pain sections.
This is why riders who ride to average gradient (in the sense of pacing to a steady wattage) misjudge the climb. There is no steady. The climb dictates surges when the road tips into its worst pitches, and it dictates a compressed recovery — if 9 percent still counts as recovery — between them. The number "12.2 percent" is honest about the total work. It is dishonest about the rhythm.
 Monte Zoncolan
The print from this article · from €29.95
View the print →
Monte Zoncolan
The print from this article · from €29.95
View the print →
Where Does the Published 22 Percent Maximum Come From?
The 22 percent figure is published by climbfinder.com and matches the Giro d'Italia road book for the Ovaro ascent. That's the source we cite, because on a climb this steep, source discipline matters.
Our own elevation data comes from OpenTopoData's SRTM 30-metre dataset — satellite-derived elevation at 30-metre horizontal resolution. That resolution is excellent for total length, total gain, and average gradient. It is imperfect for peak pitches. A road that ramps to 22 percent over ten metres can get smoothed by 30-metre sampling into a lower reported max. When published road-book figures and our measured profile disagree at the peak, we default to the road book for the maximum and to our measurement for length and total gain. On Zoncolan from Ovaro, we quote 22 percent max because the Giro says so, not because a satellite pixel confirmed it.
Is Satellite Elevation Data Reliable for a Climb This Steep?
For everything except peak pitches, yes. SRTM 30-metre data is trustworthy for the shape of a climb over its full length, for cumulative elevation gain within a few percent, and for average gradient over any segment of a hundred metres or more. It is not designed to catch a 20-metre section that briefly ramps to 22 or 23 percent.
This is the honest limit, and we name it because it is a limit the sport talks around. A climb described as "23 percent max" in a magazine may be measuring across a five-metre worst-case section that no satellite dataset will resolve. When we print the Zoncolan profile, the curve you see is a truthful representation of the road's shape — and the "max" label comes from the road book, not the satellite. Both are correct within their scope.
 Col du Galibier
The print from this article · from €29.95
View the print →
Col du Galibier
The print from this article · from €29.95
View the print →
What Makes the Middle Kilometres Decide the Ride?
Every account of Zoncolan from Ovaro converges on the middle. That is where the road makes its case. On a climb with 1,187 metres of gain over 9.74 kilometres — averaging 122 metres of vertical per kilometre — the sections that push the mean up to 12.2 percent have to sit somewhere, and on the Ovaro side they sit predominantly in kilometres three through seven.
We are careful not to over-specify what our data can support at fine spatial resolution. What the profile shows unambiguously is a climb that does not ease into itself and does not offer a false summit reprieve. The first kilometre from the village is already climbing. The last kilometre, if you have anything left, is where the road stops trying to break you and starts letting you finish. Nothing in between is generous.
Why Do Professional Times on the Ovaro Side Read Strangely?
Because they are short in wall-clock terms and enormous in physiological terms. A world-class rider can climb Zoncolan from Ovaro in the neighbourhood of 40 minutes. In wall-clock terms, that's less than a lunch break. In watts-per-kilogram terms sustained over that duration on a road averaging 12.2 percent, it is one of the harder efforts a Grand Tour asks anyone to produce, on a climb short enough to be raced flat out.
That combination — brief and maximal — is why times on this climb don't compare cleanly to times on Alpine climbs of similar duration. On the Alpe d'Huez, the road never crosses 13 percent for long. On Zoncolan from Ovaro, the road spends real time above that number. Comparing 40-minute climbs across those two roads is like comparing a 10K on a track to a 10K in soft sand — same distance, different sport.
What History Did the Ovaro Side Write Into the Giro?
The Ovaro ascent has featured in the Giro d'Italia several times since it was first introduced to the race in the early 2000s. It has served as a stage finish, decided general classifications, and produced some of the sport's more memorable images of riders zig-zagging across the road looking for a shallower line. We keep this history general on purpose: where the grounding gives us the mountain's own measurements, it doesn't give us stage-by-stage race archives, and we would rather stay broad than be precise-and-wrong on race history.
What the climb has always done, in every appearance, is compress the race. There is no waiting for Zoncolan from Ovaro to sort out a general classification. It sorts it out inside its own 9.74 kilometres, which is exactly what the profile predicts.
How Should a Rider Read This Profile Before Riding It?
As a case for the widest gear you own. That is the practical route-craft point, and we make it once because it matters: a road averaging 12.2 percent with published pitches at 22 percent is a road where cadence is a strategic resource. Riders who arrive with a compact (34×32 or 34×34) tend to describe the middle kilometres in a specific way. Riders who arrive with a 34×36 or wider describe them slightly differently.
Beyond gearing, the profile suggests a discipline: do not pace to the average. Pace to the road as it comes, and accept that heart rate will spend most of the ride at whatever ceiling you carried into it. The climb doesn't reward energy conservation the way a Galibier does. If we've drawn a print of a climb worth putting on the wall, this is one; the studio's shop is at /shop/ for anyone who wants to sit with 9.74 kilometres of measured road at eye level while they plan the ride.
FAQ
How long is Monte Zoncolan from Ovaro exactly?
The Ovaro ascent measures 9.74 kilometres from the road at Ovaro (529 metres) to the summit at 1,716 metres, based on OpenTopoData SRTM 30-metre satellite elevation data. Total elevation gain is 1,187 metres. Length figures from different sources vary by a few tens of metres depending on where the start point is drawn — we place ours at the village.
What is the maximum gradient on the Ovaro side?
The published maximum is 22 percent, sourced from climbfinder.com and confirmed by the Giro d'Italia road book. Our own satellite-derived profile smooths peak pitches at 30-metre resolution, so we defer to the road book for the max figure rather than to a number our dataset can't verify at that spatial scale.
Is the Ovaro side harder than the Sutrio side?
The Ovaro ascent is broadly considered the harder of Zoncolan's paved sides on average gradient. Our grounding data covers Ovaro only, so we won't quote a numerical comparison we can't measure ourselves. Riders who have done both consistently describe Ovaro as the one that defines the mountain's reputation.
Why does the average gradient understate how hard the climb feels?
Because 12.2 percent is a mean across 9.74 kilometres of uneven road. Half the climb is steeper. The steepest sections cluster in the middle kilometres and touch 22 percent on published figures. Pacing to the average tends to blow riders up when the road tips into its worst pitches, which happens repeatedly rather than once.
What gearing is realistic for Monte Zoncolan from Ovaro?
On a road averaging 12.2 percent with 22 percent pitches, wider is better. A compact chainring paired with a wide-ratio cassette is the practical floor for most amateur riders. This is route craft, not training advice: the climb dictates cadence, and cadence dictates whether the ride finishes.
Can I trust satellite elevation data for a climb this steep?
For length, total gain, and average gradient, yes. SRTM 30-metre data is accurate within a small tolerance for the overall shape of any road climb. For peak pitches over very short distances — the ten-metre sections that push a max reading to 22 or 23 percent — the resolution isn't fine enough. That's why we cite the road book for the maximum.
From the collection



New climbs and 10% off your first print.
One email now with your code. No noise after.