Our SRTM profiles occasionally report ramps steeper than the road book claims. The road book is right. Hear me out.
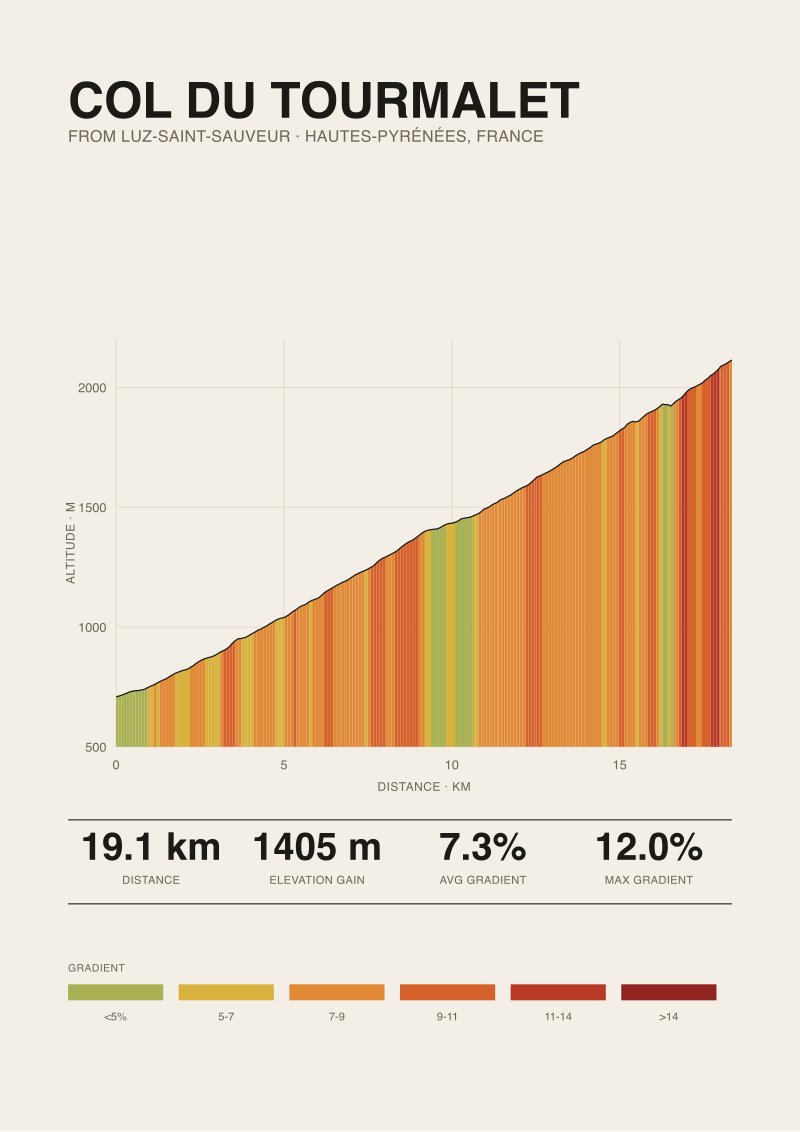
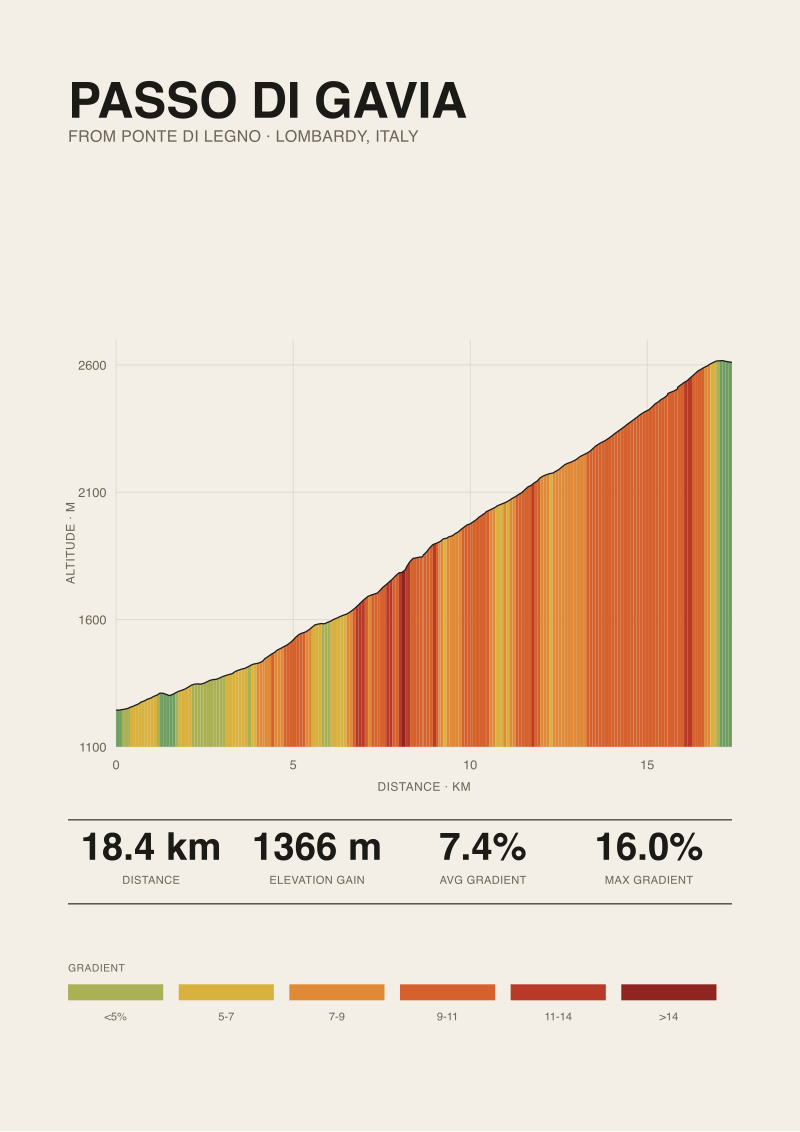
We measure every climb we draw from OpenTopoData SRTM 30m. That data lets us render an honest profile of Stelvio from Prato allo Stelvio (25.04 km, 1840 m gain, 7.3 percent average), Ventoux from Bédoin (21.51 km, 1575 m gain, 7.3 percent average), the Tourmalet from Luz-Saint-Sauveur (19.12 km, 1405 m gain, 7.3 percent average), and the Gavia from Ponte di Legno (18.42 km, 1366 m gain, 7.4 percent average). On totals, SRTM is trustworthy. On the steepest single ramp, it is not. This piece is a flowchart. We will ask three questions about the spike you are looking at. Each answer routes you toward a specific way to read it — and, more importantly, a specific way to avoid getting fooled by it.
Question 1: Is the Spike Shorter Than Roughly 60 Meters of Road?
SRTM 30m samples the ground every thirty meters horizontally. That is the number that matters. Any ramp shorter than about two pixels — call it sixty meters of road — is being estimated from two, maybe three, elevation readings. Two readings do not describe a ramp. They describe a slope hypothesis. If the samples happen to land on a lip and a shelf, the calculated gradient explodes. If they land on the shelf twice, the ramp disappears. The road is unchanged. The math is doing what the math does.
This is the first question because it eliminates the majority of spurious spikes we see on real climbs.
If Yes — the Spike Is Under 60 Meters
Discard it as a maximum. Do not tell your riding partners that the Gavia has a section at 18 percent because your GPS export says so on one thirty-metre bar. Report it as: SRTM 30m places a two-pixel excursion in this section; the published road-book maximum for the Ponte di Legno side is 16 percent. That sentence is honest. The 18 percent claim is not. Rule: if you cannot see the spike sustain across three consecutive samples, treat the peak value as a rounding artifact, not a gradient.
If No — the Spike Sustains Across 90 Meters or More
Now you are looking at a ramp SRTM can actually resolve. It may still be wrong for other reasons (Question 2 handles those), but the sample count is no longer the primary problem. Compare the sustained value against the published maximum with source attribution. On Stelvio from Prato allo Stelvio, that comparison is 14 percent from climbfinder.com. On Ventoux from Bédoin and on Tourmalet from Luz-Saint-Sauveur, both climbfinder figures land at 12 percent. If your SRTM ramp reads two or three points above those numbers on a stretch longer than ninety meters, Question 2 explains why.
Question 2: Is the Road on a Wooded Hillside or Threading Hairpins?
SRTM was built from a February 2000 radar mission. It does not see roads. It sees the top of whatever is on the ground at each pixel — bare rock, snow, or the canopy of a forest. When elevation values are pulled along a road path, the sampler picks up whatever the terrain is doing at that coordinate, including trees. On a forested Alpine or Pyrenean hillside, that adds meters of apparent elevation to some pixels and not others. The result is a noisy signal that manufactures short steep ramps that are not on the road.
Hairpins are worse. The road switches back through a section of hillside, so two road-distance points ninety meters apart may sit on terrain that a straight-line sampler treats as directly above one another. Rise stays real, run collapses, gradient inflates.
If Yes — Trees or Hairpins in the Section
Assume a systematic upward bias on the reported maximum of two to four percentage points. Do not treat any SRTM ramp value in that section as authoritative. The published road-book maximum, even if you doubt its precision, is the more trustworthy anchor. On the Tourmalet from Luz-Saint-Sauveur, the entire lower half is exactly this: hairpin architecture on a forested valley wall. When our SRTM export shows peaks above the 12 percent climbfinder figure in that stretch, we assume the sampler is being tricked, not that we have found a new maximum.
If No — Open Terrain, Straight Alignment
The bias shrinks. Ventoux above Chalet Reynard is bare limestone and open road. Stelvio's upper hairpins sit above the tree line but the switchback geometry is dense enough that the run-collapse problem re-appears. Only genuinely open, straight stretches — of which there are fewer than riders think — give SRTM a fair chance at the maximum. In those stretches, a sustained SRTM ramp that reads one to two percent above a road-book figure is worth investigating rather than dismissing.
 Passo dello Stelvio
The print from this article · from €29.95
View the print →
Passo dello Stelvio
The print from this article · from €29.95
View the print →
Question 3: Where Does Your Published Comparison Come From — a Road Book, or Another Satellite Source?
This is the question most cycling media skips. When somebody tells you a climb's maximum gradient, ask which layer of data that number came from. Road-book figures are surveyed against physical road signage, official cadastral maps, or engineering documents. Other-satellite figures — a Strava segment maximum, a friend's Wahoo export, a third-party site republishing another site's SRTM sample — carry the same 30-meter sampling problem you are trying to correct for.
If It Is a Road-Book Number
Trust it as the comparison anchor. Our four grounded examples all cite climbfinder.com published maxes: Stelvio 14 percent, Ventoux 12 percent, Tourmalet 12 percent, Gavia 16 percent from the Ponte di Legno side. Those are the numbers we compare our SRTM profiles against. When our data disagrees, we say our data disagrees — and we do not raise the reported maximum on the strength of a satellite reading alone.
If It Is Another Satellite Number
You do not have a comparison. You have two versions of the same measurement error. Two SRTM samples of the same ramp agreeing does not confirm the ramp exists at that gradient. It confirms that the same terrain model produces the same output twice. Discard the exercise. Go find a printed road book, a signposted gradient, or an official pass profile before drawing any conclusion about the maximum.
If You Answered Everything
| Q1: Spike ≥ 90 m? | Q2: Trees or hairpins? | Q3: Comparison is road-book? | Recommendation |
|---|---|---|---|
| No | No | Yes | Reject the SRTM maximum. Report the road-book figure with attribution. |
| No | No | No | Reject the SRTM maximum. Find a road-book source before publishing anything. |
| No | Yes | Yes | Reject the maximum outright. Two independent reasons to distrust it. |
| No | Yes | No | Discard the whole exercise. You are averaging two noise sources. |
| Yes | No | Yes | Report the SRTM ramp value alongside the road-book figure and name the gap. |
| Yes | No | No | Sustained ramp, clean terrain — but still no trustworthy anchor. Keep looking. |
| Yes | Yes | Yes | Anchor to the road book. Note the SRTM excursion as terrain-model noise. |
| Yes | Yes | No | Two suspect sources agreeing on a ramp is not evidence. Withhold judgment. |
Read the table as a survival tool, not a scoring rubric. The only combination where SRTM earns the right to be quoted as a gradient maximum is Yes / No / Yes — a sustained ramp, on open terrain, with a road-book number in hand to compare against. Every other row is telling you the same thing in different words: the profile is honest about the mountain, and worth doubting about the one number cycling media most loves to quote.
That is the trade we make when we render a climb from SRTM 30m. Totals are steady — the 1840 m of Stelvio, the 1575 m of Ventoux, the 1405 m of Tourmalet, the 1366 m of Gavia. Averages are steady — all four sit within a tenth of a point of 7.3 to 7.4 percent, which is what makes them comparable objects at all. The single steepest ramp is the number that moves. On our prints, that is a feature of the medium. On somebody else's blog post, it is often a mistake being retweeted.
This piece does not address LiDAR-derived elevation datasets, which resolve the sampling problem at the cost of coverage — most European climbs still lack public LiDAR, and where LiDAR does exist, the workflow to merge it with route geometry is a separate argument. It does not address how gradient smoothing windows on cycling head-units affect the ramps riders actually feel, which is a rider-perception question rather than a data question. And it does not address descents, where the same SRTM issues apply in reverse and matter less because nobody is trying to compare their maximum negative gradient with a road book.
If a print of one of the four climbs above belongs on your wall — measured, drawn, and honest about its own limits — the studio's shop is where those exist.
 Col du Tourmalet
The print from this article · from €29.95
View the print →
Col du Tourmalet
The print from this article · from €29.95
View the print →
FAQ
What resolution is SRTM data, and why does that number matter for cycling gradients?
The Shuttle Radar Topography Mission dataset most commonly used for cycling profiles is SRTM 30m — one elevation sample per thirty meters horizontally. Any road ramp shorter than roughly two samples cannot be resolved as a gradient; it is estimated from too few points. That is the single biggest reason SRTM-derived maximums disagree with road-book figures on climbs like Gavia, where the published max from Ponte di Legno is 16 percent according to climbfinder.com.
If SRTM is unreliable for maximum gradients, why do you use it at all?
Because it is honest about the numbers that describe a climb as an object: total length, elevation gain, and average gradient. On Stelvio from Prato allo Stelvio, we measure 25.04 km and 1840 m of gain via OpenTopoData SRTM 30m. On Ventoux from Bédoin, 21.51 km and 1575 m. Those figures are stable and comparable. The single steepest ramp is the outlier — treat it as such and the rest of the profile stands.
How much does SRTM typically overestimate on wooded hillsides?
There is no single number, because the bias depends on canopy density, terrain roughness, and how the sampler interpolates between pixels. As a working rule inside the studio, we assume two to four percentage points of upward drift on maximum gradient values pulled from SRTM through forested sections. That is not a claim about a specific climb — it is a caution against quoting an SRTM maximum from a section like the lower Tourmalet as authoritative.
What is a road-book gradient and why treat it as more trustworthy?
A road-book figure is derived from surveyed measurements — physical road signage, cadastral maps, or engineering documents produced when the road was built or resurfaced. It is not free of error, but its errors are not the SRTM sampling error. Our four grounded climbs cite climbfinder.com maxes of 14 percent (Stelvio), 12 percent (Ventoux), 12 percent (Tourmalet) and 16 percent (Gavia). Those anchor the comparison; SRTM does not overturn them alone.
Do modern high-resolution satellite datasets fix this problem?
Higher-resolution datasets — LiDAR-derived elevation models in particular — do resolve the sub-30-meter ramp problem. The trade-off is coverage. Public LiDAR coverage across European road climbs is patchy, alignment with route geometry adds engineering work, and the outputs still need validation against road-book figures before being published. We flag this as an area we do not currently draw from, not as a problem already solved.
Should I trust the maximum gradient on my GPS head unit?
Head-unit maximums apply smoothing windows that vary by manufacturer and firmware. Two devices ridden side by side on the same ramp can report different peaks, and neither is measuring the road directly — they are computing gradient from GPS altitude changes, themselves derived from a terrain model plus barometric correction. The maximum number on the screen is a device-specific summary, not a physical property of the climb. Compare with a road book before quoting it.
Why do all four of your grounded climbs have the same average gradient?
Stelvio, Ventoux, Tourmalet and Gavia all measure between 7.3 and 7.4 percent average from the ascents we drew. That is not a coincidence — it is close to the ceiling that a road engineered for continuous vehicle traffic can hold over fifteen-plus kilometers before switchback density has to increase sharply. Climbs at 9 or 10 percent averages exist, but they are shorter or narrower. The four legends cluster at 7.3 because that is where the road-building compromise sits.
From the collection


New climbs and 10% off your first print.
One email now with your code. No noise after.