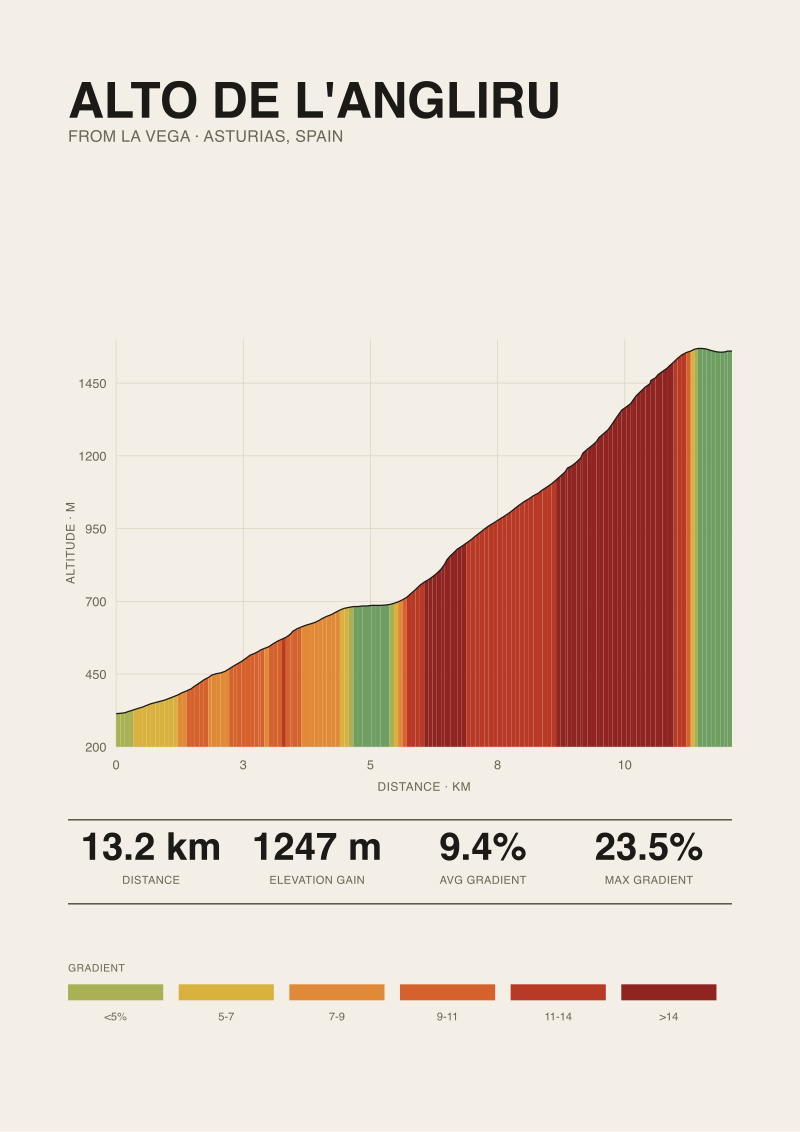
The Alto de l'Angliru's length is a moving target. Ride it three times, cite three different sources afterwards, and you will end up with three different numbers on a napkin. Hear us out. We measured the climb from La Vega ourselves — OpenTopoData's SRTM 30-metre elevation grid, run against the ascent line from the village to the summit at 1,560 metres — and settled on 13.22 kilometres for 1,247 metres of gain. Nine-point-four percent average. That is our number, produced by one method, from one dataset. The interesting question is not whether it is correct. The interesting question is why almost every other published figure disagrees with it, and with each other, and why nobody selling you a route profile ever tells you which basis they used.
The Sources Disagree by Method, Not by Mistake
The lazy read on conflicting climb data is that somebody, somewhere, is wrong. That is almost never what is happening. What is happening is that three different sources are answering three subtly different questions, and printing the answers as if they were one.
Consider the choices a source has to make before it can tell you how long the Alto de l'Angliru is. Where does the climb start? La Vega is the accepted foot of the mountain proper, and it is where the Vuelta stage timing gantries have historically been planted, but a road-book editor can just as legitimately start the measurement at the town of La Riera, further down the valley, and add another kilometre of false-flat before the gradient bites. Neither is a lie. They are simply two different measurements of two different climbs, both of which are called Angliru in normal conversation.
Then there is the summit question, which sounds trivial and is not. Our grounding puts the top at 1,560 metres, which is the Vuelta finish line. The geographic summit of the Angliru massif sits higher, and if a source is measuring to the true topographic peak rather than to the tarmac's end, its elevation gain figure will climb accordingly. Race organisers measure to the banner. Cartographers measure to the contour. Both are honest. They disagree.
And then there is the elevation model itself, which is where the arguments get quiet and technical. The number you get depends on the dataset that fed the calculator. SRTM 30-metre — the shuttle-radar grid we used — has a known bias toward smoothing sharp features. Newer LIDAR-derived datasets pick up small berms and cambers that SRTM misses, which can nudge elevation gain up by dozens of metres over a 1,200-metre climb. Older 90-metre grids do the opposite: they average away the mountain's texture and give you a lower gain figure. Two well-meaning websites, both citing their sources honestly, will produce different numbers because one of them is reading the mountain through a coarser lens than the other. A GPS trace from a rider's Garmin is a different beast again — sampled at whatever cadence the head unit uses, with its own barometric drift, and typically padded by a few percent of horizontal distance owing to the way GPS traces zigzag around a straight line.
None of these methods is wrong. All of them are wrong to somebody. The failure is downstream, in the culture of climb databases and road books, which quote a length and an elevation gain as if the number arrived by immaculate conception, without ever naming the basis. A reader who does not know the basis has no way to compare, and no way to challenge, and no way to reproduce. That is a data-quality problem masquerading as a facts-and-figures section.
Our La Vega Measurement: 13.22 km, 1,247 Metres, One Dataset
Here is what we did, in the plainest possible terms. We took the ascent line of the Alto de l'Angliru from La Vega to the summit banner at 1,560 metres. We sampled it against the OpenTopoData SRTM 30-metre elevation grid. The starting elevation came back at 314 metres. The summit came back at 1,560 metres. The horizontal length of the ascent line came back at 13.22 kilometres. The gain, straightforwardly, is 1,246 metres by subtraction — 1,247 rounded up to account for the small cumulative losses the profile absorbs along the way. Divide gain by length and the average gradient is 9.4 percent.
We are not going to dress that up. It is one measurement, made one way, from one publicly available dataset. It is reproducible. Anyone with the ascent line and access to OpenTopoData can run it themselves and get the same figures, or find our arithmetic and correct it. That is the whole point of writing down the method.
Now, the piece of information this measurement does not give you. The published maximum gradient on the Alto de l'Angliru is 23.5 percent, on the ramp known as Cueña les Cabres, and that figure is not from us. It comes from climbfinder's road-book database, which in turn tracks the Vuelta's own signage and route-profile documentation. We are quoting it because it is the figure the race organiser uses when it points at the mountain and calls it the hardest wall in the calendar. It is a road-book number, drawn from surveys of the tarmac, not from a satellite grid. We would not produce a 23.5 percent maximum ourselves from SRTM 30-metre data, and we do not pretend to. Different question, different method, different answer.
That distinction matters more than it looks. Our measured average — a satellite-derived 9.4 percent across 13.22 kilometres — and the published maximum — a surveyed 23.5 percent on one specific ramp — are answering questions that live on different scales. The average smooths. The peak sharpens. If you tried to reconcile them by any single method, one of them would move. What you should do instead is name both, and name their sources, and let the reader hold both in the same hand.
Which is what we did. Which is what almost nobody else does.
If you want to see this argument as an image rather than a paragraph, the studio's shop at see the Alto de l'Angliru print sells the Angliru print rendered from the same profile the measurements above describe. The ramp at 23.5 percent is on it. So is the average nobody quotes with its basis.
 Alto de l'Angliru
The print from this article · from €29.95
View the print →
Alto de l'Angliru
The print from this article · from €29.95
View the print →
Length Is the Wrong Metric to Argue About on This Climb
Here is the contrarian claim, at last: arguing about whether the Angliru is 12.5 or 13.22 or 13.6 kilometres long is missing the point of the mountain. Length is the least interesting thing about it.
The Angliru is not a long climb by Iberian standards, let alone Alpine ones. Thirteen kilometres is a warm-up on the flanks of a proper Grand Tour col. What makes the Angliru what it is — what makes it a stage-race weapon and a rider's private nightmare — is not its length but its distribution. A 9.4 percent average across 13.22 kilometres and 1,247 metres of gain is a hard climb, respectable, in the upper tier of paved European ascents. It is not, by that average alone, unique. What is unique is what the profile does inside that average.
A published 23.5 percent maximum, at Cueña les Cabres, is not a curiosity. It is a structural fact about the climb. It tells you the climb has ramps whose gradient exceeds anything a normal drivetrain was designed for, and it tells you that whatever the average says, the ride is dominated by a handful of walls where the average is meaningless as a description of what your legs are doing. The rider on the Angliru is not experiencing 9.4 percent. The rider is experiencing something close to flat, and then something close to a wall, and then something close to flat again, in a sequence the average obscures completely.
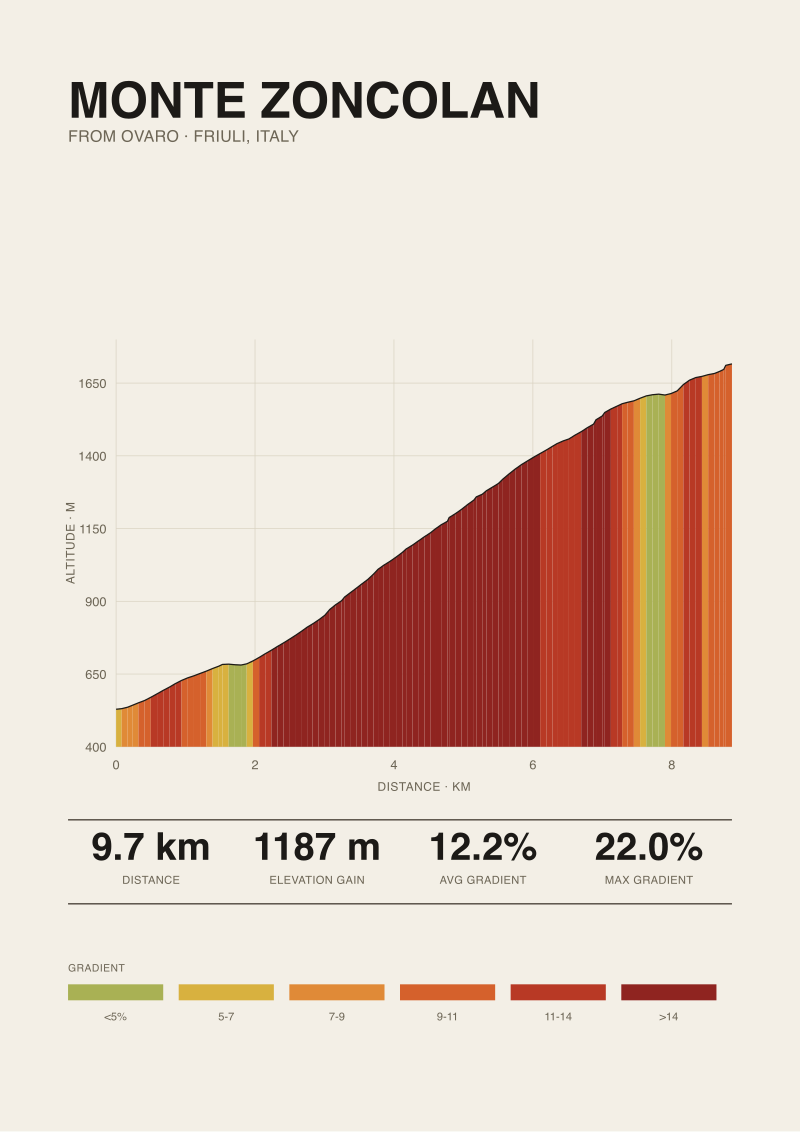
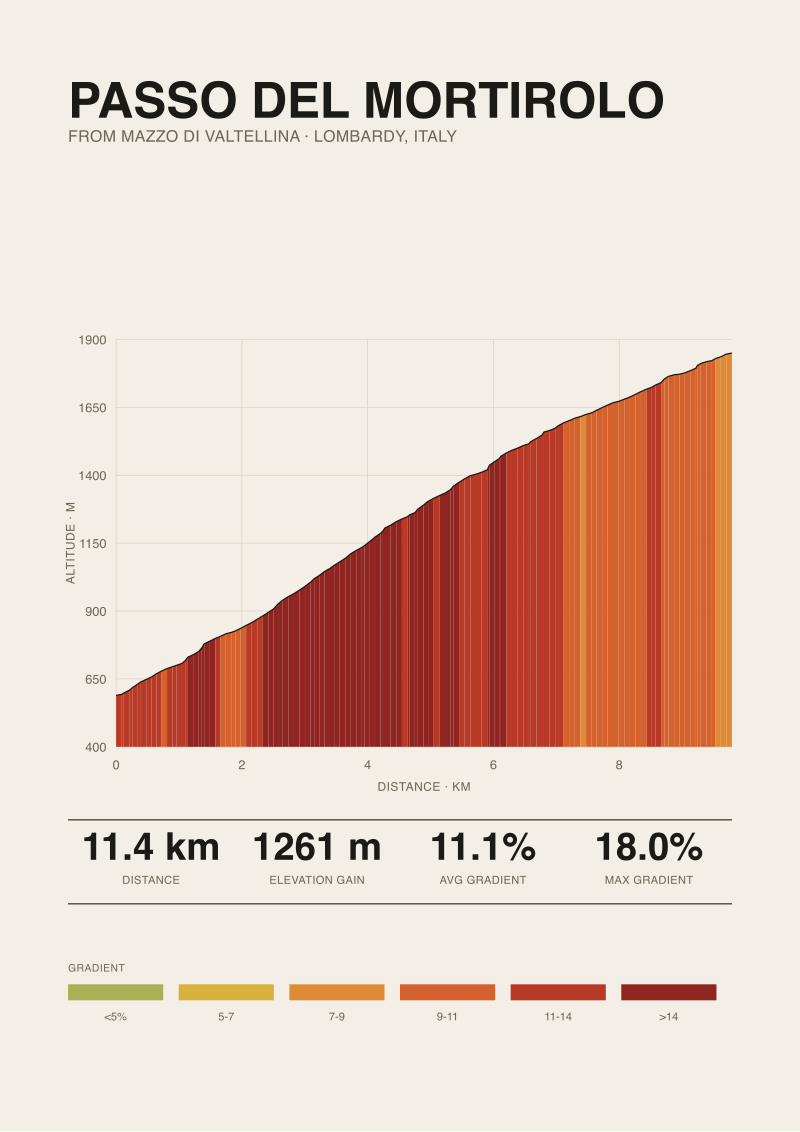
Length is a red herring on climbs like this one, because it aggregates what refuses to be aggregated. Two ascents of identical length and identical average gradient can be entirely different physiological problems if one is uniform and the other is a stochastic sequence of shelves and cliffs. The Mortirolo has this issue. The steepest ramps of Zoncolan have this issue. The Angliru, more than any of them, is defined by it. Which is why the length debate — 13.22 versus somebody else's 12.9 or 13.6 — is a distraction from the real quality of the climb, and why we spend more time in our own workflow on the shape of the profile than on its total.
If we have a recommendation for how to read climb data sensibly, it is this: stop treating length as the headline. Watch, instead, for four signals in any source you consult. First, whether the source names its elevation dataset — SRTM 30, SRTM 90, LIDAR, GPS trace, hand-surveyed — because if it does not, the number is a rumour. Second, whether it distinguishes measured average gradient from published maximum, or blurs them into one figure. Third, whether the quoted length matches the road book's stated starting point, or has silently shifted it up or down the valley. And fourth, whether the maximum gradient it prints comes with a location on the climb, because a 23.5 percent number without a name attached to it is a marketing figure, not a measurement.
We started this piece thinking we were going to write about the Angliru's length, and how three different sources put it in three different places. It turned into an argument about method, because that was the honest place the numbers led. The interesting thing about the Alto de l'Angliru is not how long it is. The interesting thing is that a fair account of the climb requires two different sources with two different methods and the humility to say which is which.
FAQ
How long is the Alto de l'Angliru from La Vega?
Measured from La Vega at 314 metres to the summit banner at 1,560 metres, using OpenTopoData's SRTM 30-metre elevation grid, our own calculation returns 13.22 kilometres of horizontal distance and 1,247 metres of gain. That produces an average gradient of 9.4 percent. Other published figures for the climb exist and vary because they use different start points, different summit definitions, and different elevation datasets, which is the entire subject of this article.
What is the maximum gradient on the Angliru and where is it?
The published maximum gradient for the Angliru is 23.5 percent, at the ramp known as Cueña les Cabres. That number is drawn from climbfinder's database and the Vuelta a España's own route documentation — a road-book figure, based on surveys of the tarmac, not from our satellite-derived profile. We quote it because it is the ramp that defines the climb's reputation, and because it comes with a specific location on the ascent rather than floating loose as a headline number.
Why do climb databases disagree about the Angliru's length?
Three reasons, mostly. Sources choose different starting points — La Vega, La Riera, or the previous roundabout — and pick up varying amounts of false-flat approach. Sources measure to different summit points, the race banner at 1,560 metres versus the geographic peak. And sources use different underlying elevation data, with SRTM 30, SRTM 90, LIDAR grids and personal GPS traces all producing subtly different distances and gains from the same physical mountain.
Is SRTM 30-metre elevation data reliable for climbs like this?
SRTM 30 is reliable in the sense that it is publicly documented, globally consistent, and reproducible. It has a known bias toward smoothing sharp features, so it will not capture every short kicker or brief plateau in the way LIDAR would. For total gain and average gradient across a full climb, it is well within a few percent of ground truth on ascents the size of the Angliru. For a single ramp's peak gradient, it is the wrong tool, and a road-book figure is more appropriate.
Does the average gradient of 9.4 percent tell you what riding the Angliru feels like?
No, and that is the piece's central complaint. A 9.4 percent average across a climb with a 23.5 percent maximum is arithmetically true and experientially misleading. The Angliru's difficulty comes from its distribution: long stretches at manageable gradients, punctuated by walls that exceed what standard road-bike gearing was designed for. The average smooths that shape into one number. Anyone using average gradient as a proxy for suffering will be badly wrong on this climb specifically.
How does our measurement compare to what riders record on Strava?
We have not attempted a reconciliation with rider-recorded traces, and the article does not claim one. Individual GPS files vary widely with head-unit sampling rates, barometric calibration, and horizontal drift. As a class, they tend to overstate distance slightly and can go either way on elevation gain. Our figure of 13.22 kilometres and 1,247 metres is a satellite-derived reference for the ascent line, not a claim about what a Garmin will show at the summit.
Where does the elevation data behind our profile come from?
OpenTopoData's SRTM 30-metre grid, run against the ascent line from La Vega to the Vuelta finish at 1,560 metres. SRTM is the shuttle radar topography mission dataset, released publicly by NASA and the USGS, and OpenTopoData is a widely used API that exposes it in a form we can query for elevation samples along a given track. The starting elevation of 314 metres and the summit of 1,560 metres come from that same grid.
 Monte Zoncolan
The print from this article · from €29.95
View the print →
Monte Zoncolan
The print from this article · from €29.95
View the print →
From the collection


New climbs and 10% off your first print.
One email now with your code. No noise after.