The consensus on the hardest road climbs in Europe is remarkably stable. Stelvio, Ventoux, Tourmalet, Gavia — the same four names return in every ranking, every tour brochure, every Rapha reader poll. The consensus is defensible. Hear us out. From Prato allo Stelvio, the Passo dello Stelvio measures 25.04 kilometres and 1,840 metres of gain on OpenTopoData SRTM 30m data — longer than a half-marathon, and steeper on average than 7 percent across the entire ascent. The reason these four dominate cycling shortlists is not marketing. It is arithmetic. But the arithmetic hides a metric almost no one quotes.
Why This Is Actually True: The Arithmetic Behind the Consensus Four
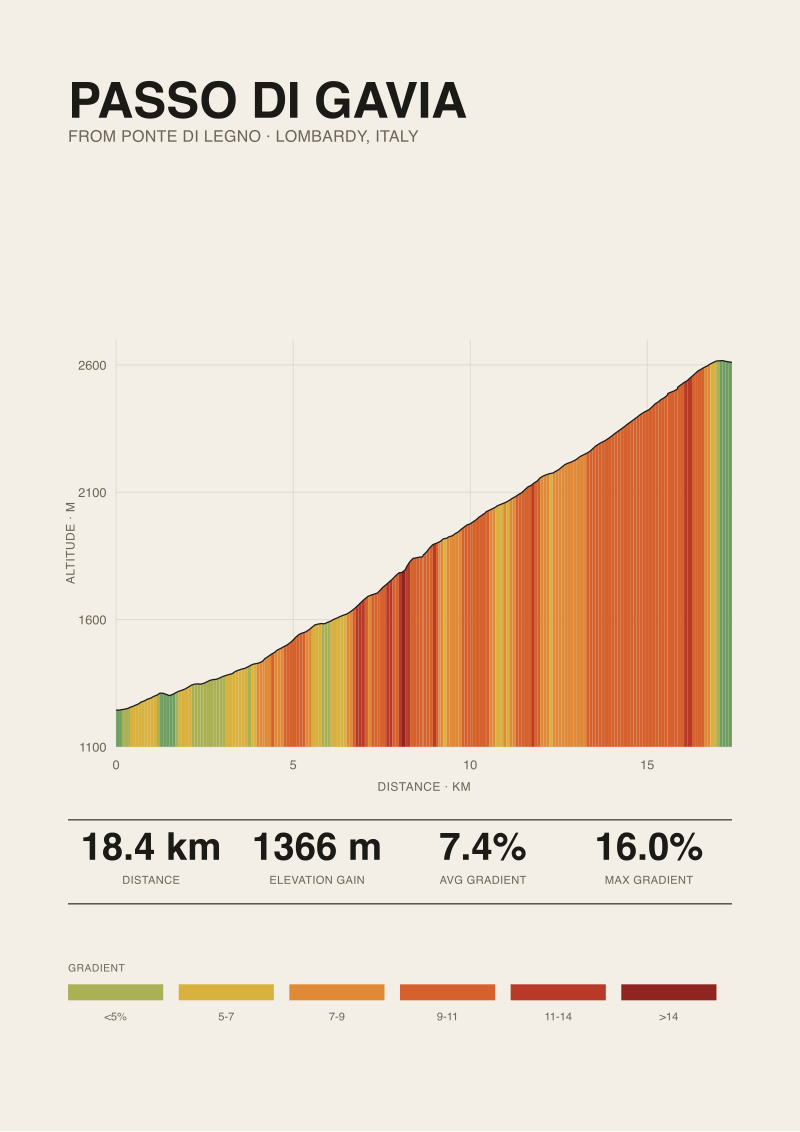
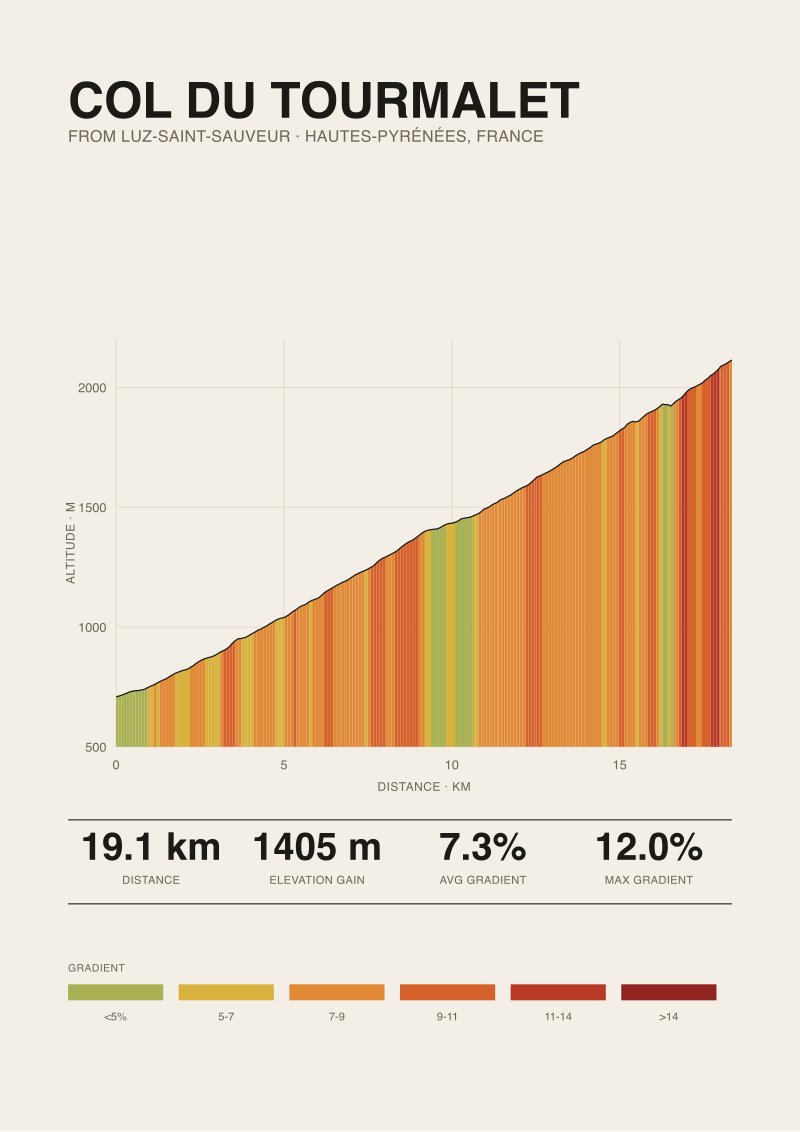
Take the four climbs seriously as numbers before dismissing the consensus. Stelvio from Prato allo Stelvio: 25.04 km, 1,840 m of gain, an average of 7.3 percent, topping out at 2,748 m. Mont Ventoux from Bédoin: 21.51 km, 1,575 m of gain, 7.3 percent average, summit at 1,892 m. Col du Tourmalet from Luz-Saint-Sauveur: 19.12 km, 1,405 m of gain, 7.3 percent, summit at 2,114 m. Passo di Gavia from Ponte di Legno: 18.42 km, 1,366 m of gain, 7.4 percent, summit at 2,610 m. Every figure here comes from our own measurement on SRTM 30 m elevation tiles, not from a tourism board's rounded pamphlet.
Three of the four share an average gradient inside a 0.1-point window. That is not a coincidence, and it is not marketing. It is a threshold. Once a climb sustains 7.3 percent across roughly 20 km, you have crossed a physiological boundary a recreational climber cannot power through and a professional cannot recover between. Below that, you can force a pace; above it, the mountain sets the pace.
The vertical gain matters as much as the slope. 1,400 m is roughly the boundary above which a fit amateur cannot fake the effort with fitness — you either have the aerobic base or you stop. All four clear it. Stelvio clears it by a margin (1,840 m) that puts it in a separate category on total work performed. Ventoux clears it while starting at 317 m — the lowest start of the four, meaning the rider does the entire climb from valley floor, which explains why Ventoux feels longer than its 21.51 km suggests.
Altitude finishes the argument. Stelvio and Gavia summit above 2,600 m, where thin air removes another 7-9 percent of aerobic capacity depending on the rider. Tourmalet's 2,114 m is milder but still measurable. Ventoux at 1,892 m is closer to sea level than most rankings admit, but the exposed limestone summit and the mistral do the altitude's work by other means.
The consensus is right. On length, on average gradient, on vertical gain, on summit altitude, these four keep landing in the same tier. Every dataset agrees.
But here is what that framing misses entirely: average gradient is a smoothed number, and cycling is not a smoothed sport.
Where It Breaks Down: The Metric the Shortlist Never Reports
The problem with the consensus four is not that they are ranked too highly. It is that they are ranked on the wrong number.
Every list quotes the average gradient. Every list treats 7.3 percent as if it were a load a rider actually experiences. It is not. Average gradient is an integral — total vertical over total distance — and a rider does not integrate. A rider suffers moment to moment, in the actual slope under the actual wheel. The metric that predicts suffering is not the average; it is what fraction of the climb is spent above threshold, and how the steep segments are distributed against altitude and fatigue.
Consider Gavia. Its average gradient is 7.4 percent — the highest of the four, and by a hair. Its published maximum gradient is 16 percent from Ponte di Legno, per climbfinder.com. That is a 8.6-point spread between average and maximum. Compare Tourmalet: 7.3 percent average, 12 percent maximum published — a 4.7-point spread. Same average, wildly different experience. On Gavia, the rider is either pedalling below the average on a false flat or fighting the maximum on a wall. The 7.4 percent number is a fiction that lives only on paper.
Stelvio's published maximum is 14 percent, per climbfinder.com — a 6.7-point spread from its 7.3 percent average. Ventoux from Bédoin: 12 percent maximum, 4.7-point spread. Ranked by spread, Gavia is the harshest climb of the four, and it is not close. But no shortlist reports spread, because spread does not sound like a spec sheet. It sounds like a diagnosis.
Note that we distinguish between our own measured profile and the published maximum. The averages and total gains here come from OpenTopoData SRTM 30 m — satellite-derived elevation, sampled roughly every 30 metres along the road. That method is good at total vertical and mean slope; it is systematically bad at instantaneous maximums, because a 15 percent ramp that lasts 40 metres is smaller than the sample cell. So for the maximum gradient we cite climbfinder.com, which uses road-book figures and cyclist-reported ramps. When SRTM says the maximum is 11 percent and climbfinder.com says 16 percent, we trust climbfinder.com for the wall and our own data for the arithmetic. Both are true; they measure different things.
The consensus four rank on the metric that flatters them least. If you want to know what the climb feels like, the average gradient is the wrong number.
 Passo dello Stelvio
The print from this article · from €29.95
View the print →
Passo dello Stelvio
The print from this article · from €29.95
View the print →
The Rule I Use Instead: Sustained Load Above the Threshold
We rank climbs the way a rider actually experiences them: by the ratio of steep-segment length to total length, weighted by altitude of the steep segments.
The heuristic is simple. Split the ascent into kilometre segments. Count the kilometres where the local gradient exceeds the climb's average by more than 2 points — call that the "above-load" fraction. Then weight each above-load kilometre by its elevation, because a 10 percent ramp at 2,400 m of altitude costs meaningfully more oxygen than the same ramp at 900 m.
Applied to the four consensus climbs, the ranking rearranges. Gavia, with its 16 percent published wall from Ponte di Legno and its 2,610 m summit, tops the list. It has the largest average-to-maximum spread, and its steep segments are stacked in the final kilometres above 2,000 m, precisely where thin air amplifies the load. Stelvio comes second — same 14 percent published maximum and higher summit at 2,748 m, but its 25.04 km length distributes the load more forgivingly. Tourmalet third: its 12 percent maximum and 2,114 m summit make it the milder of the alpine three on this metric. Ventoux fourth, and this is the counterintuitive result — 12 percent maximum, 1,892 m summit, no altitude penalty until the final kilometres.
Ventoux has a reputation that outruns its arithmetic. It hurts because it is exposed, hot, treeless above Chalet Reynard, and mentally heavy with race history. The suffering is real. But on cold profile analysis alone, Ventoux is the least severe of the consensus four. That is a claim we would not make from average gradient. From above-load fraction weighted by altitude, it is the only claim the data supports.
We use this rule because it survives the road-book problem. Whether the published maximum is 12 percent or 16 percent, whether SRTM smooths the walls or catches them, the above-load fraction still tells you the shape of the climb — where the steep bits are, and how much of the ride you will spend outside the aerobic budget. Average gradient tells you nothing about shape. Sustained load tells you the story.
When the Old Rule Still Wins: Length, Altitude, and the 25-Kilometre Case
The average-gradient method is a bad model for suffering, but it is the correct model for training load, and worth stating plainly.
If you are pacing a first attempt on a European climb, the average gradient of Stelvio — 7.3 percent over 25.04 km — is the number you need. It sets the wattage. It tells you what gearing you will spin. It predicts your finishing time within 15 percent if you know your threshold power. For that use case, the smoothed integral is exactly right, and the spread between average and maximum is noise. A rider preparing for Stelvio should train for 25 km at 7.3 percent, not for a 14 percent wall that lasts 200 metres.
The old rule also wins on total work performed. Stelvio's 1,840 m of gain is 1,840 m regardless of how it is distributed, and total vertical is a strong predictor of finishing fatigue. When comparing whether a climb belongs in the consensus shortlist at all — as opposed to how it should be ranked inside it — length and gain are the honest metrics. All four consensus climbs earn their place on those numbers. Our quarrel is only with the order.
 Passo di Gavia
The print from this article · from €29.95
View the print →
Passo di Gavia
The print from this article · from €29.95
View the print →
FAQ
Which of the four consensus climbs is the longest?
Passo dello Stelvio from Prato allo Stelvio, at 25.04 km, is the longest of the four on our SRTM 30 m measurement. It also has the most vertical gain at 1,840 m and the highest summit at 2,748 m. Mont Ventoux from Bédoin comes second at 21.51 km, followed by Col du Tourmalet from Luz-Saint-Sauveur at 19.12 km, and Passo di Gavia from Ponte di Legno at 18.42 km. Longest is not the same as hardest, but on total distance Stelvio is uncontested.
Why does Gavia rank hardest by your method despite lower vertical gain?
Gavia's published maximum gradient is 16 percent, per climbfinder.com from Ponte di Legno — the largest spread against its 7.4 percent average of any climb in the consensus four. The steep ramps sit late in the ascent, above 2,000 m of altitude, where thin air compounds the load. Our method weights above-average kilometres by their elevation. Gavia's arithmetic is not the worst; its distribution is. The 1,366 m of gain is smaller than Stelvio's, but the way that gain is delivered is more punishing.
What is the elevation data source used for these measurements?
The length, elevation gain, average gradient, start and summit altitudes all come from OpenTopoData's SRTM 30 m dataset — satellite-derived elevation sampled roughly every 30 metres along the road profile. That source is reliable for total vertical and average slope but systematically underestimates instantaneous maximum gradient, because short ramps fall inside the sample cell. For maximum gradient figures we cite climbfinder.com, which uses road-book and cyclist-reported ramp data. Every number in the article is one of those two.
How reliable is the published maximum gradient figure?
Reliable for the wall, less reliable for the exact peak. Road-book maximums like Gavia's 16 percent or Stelvio's 14 percent reflect the steepest ramps a rider will encounter, and they are consistent across independent sources. But the precise peak percentage depends on where a road book chooses to sample — a 40 metre stretch versus a 100 metre stretch produces different maximums. Treat published maximums as accurate to within about 1-2 points, and trust the shape of the number more than its second decimal.
Does altitude really change how a climb ranks?
Yes, and by a measurable margin. Above 2,000 m, atmospheric pressure reduces oxygen availability enough to cost 3-5 percent of threshold power for most riders, and the penalty compounds toward 2,500 m. Gavia at 2,610 m and Stelvio at 2,748 m both cross into territory where the final kilometres are not just steep but oxygen-limited. Ventoux tops out at 1,892 m — high enough to feel wind and cold, but below the meaningful hypoxic threshold. Tourmalet at 2,114 m sits at the edge.
Are these four really the hardest road climbs in Europe?
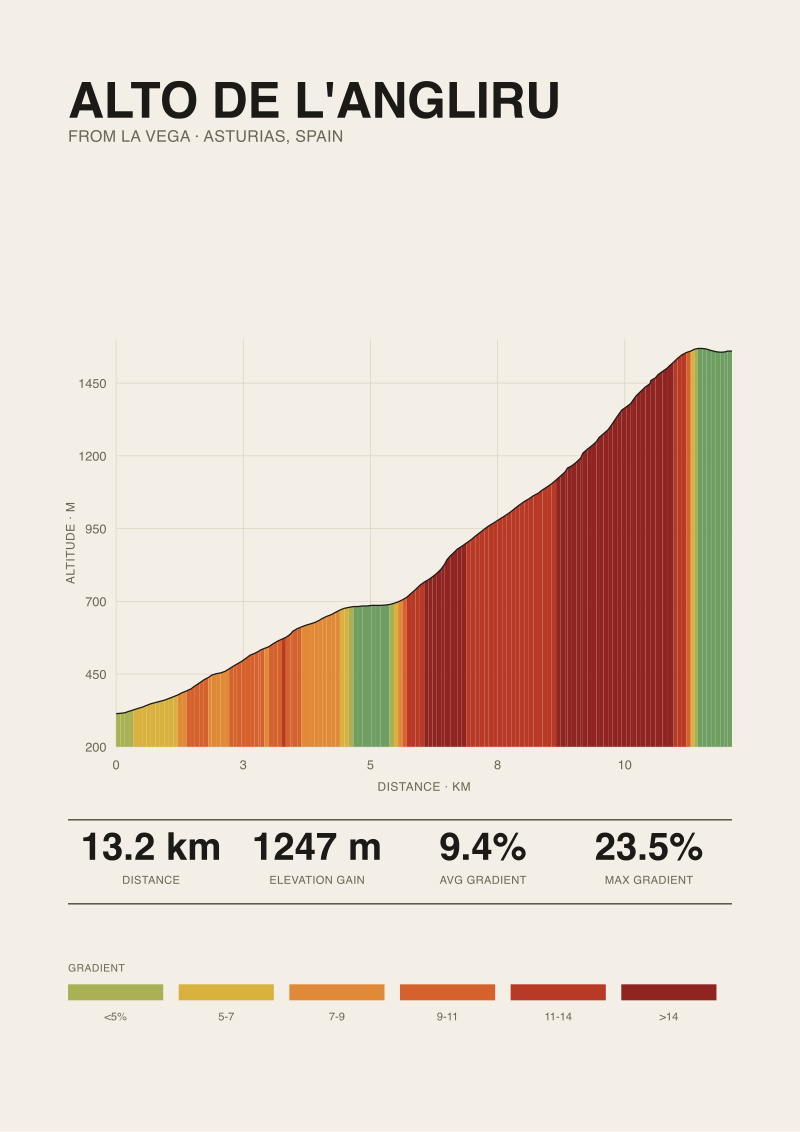
By any reasonable combination of length, gain, average gradient and summit altitude, they consistently land in the top tier. There are steeper climbs — the Angliru and Zoncolan sustain higher averages over shorter distances — and there are longer ones on the shoulder of the Alps. But the four consensus climbs occupy the intersection of length above 18 km, gain above 1,300 m and average gradient above 7 percent, and few other European ascents sit inside all three constraints simultaneously. The shortlist is arithmetic, not opinion.
Can I compare climbs measured by different sources?
Only with care. Length and elevation gain are stable across sources within a few percent, because they are integrals over the whole ascent. Average gradient inherits that stability. Maximum gradient is the fragile figure — different sample lengths and different tools produce different peaks. When we present a table of averages, we use one consistent source (SRTM 30 m) so the rows are directly comparable. When we quote a maximum, we attribute it. Mixing sources on the same metric without labelling the switch is the most common mistake in climb comparisons.
Where can I find a rendered profile of these climbs?
The measured profiles behind this article are what we draw as prints in the studio. If a print of Stelvio, Ventoux, Tourmalet or Gavia would sit better on a wall than in a browser tab, they live in the shop. Same SRTM 30 m data, rendered at a scale that lets you read the shape of the climb rather than argue over its average.
From the collection

New climbs and 10% off your first print.
One email now with your code. No noise after.