18.37 kilometres. That is the routed length of the Valloire side of the Col du Galibier as measured by OSRM against SRTM 30-metre elevation data, sampled at eight points between the 1,412-metre start and the 2,634-metre summit. Published road books quote a maximum gradient of 10.1% for the same ascent, sourced from climbfinder.com. Our profile does not contradict that figure — it contextualises it. Before we drew the print, we measured the mountain; before we measured the mountain, we defined what "measuring" would mean. This article documents both, because a climb profile is only as honest as the method behind it.
Methodology: SRTM Elevation, OSRM Routing, 8 Sample Points
Two data sources sit behind every number on our Galibier profile. The road itself — its geometry, its bends, its actual driven distance — comes from OSRM, the Open Source Routing Machine, which builds routes on top of the OpenStreetMap graph. Elevation for each point along that route comes from OpenTopoData's SRTM 30-metre dataset, the Shuttle Radar Topography Mission raster resampled to roughly one sample every thirty metres of horizontal ground.
The routing engine gives us the length that a rider actually pedals, not the map-flat Euclidean line between Valloire and the summit. The elevation raster gives us altitude at any coordinate we hand it. Together they produce a cumulative profile: distance travelled versus metres climbed.
The eight sample points refer to our accuracy check, not the resolution of the drawing itself. We render the print at a much finer step — the eight samples are audit anchors, distributed between the 1,412 m start and the 2,634 m summit, used to verify that the aggregated profile agrees with the source raster within tolerance. If any single anchor drifts more than a few metres from its SRTM reading, we investigate before the print is cut.
Limitations are worth naming. SRTM 30 m is a global elevation model, not a bespoke laser scan of the Galibier road surface. It measures ground, not asphalt. Where the road cuts through forest, snow bank or steep talus, the raster's line-of-sight sampling can drift. OSRM follows OSM ways, which are drawn by humans. Neither source is wrong, but neither is a substitute for a wheeled odometer in the hands of a rider who has climbed the col at dawn.
Finding #1: The 18.37 km Length Is Routed, Not Straight-Line
The number that matters here is 18.37 km, and it is the routed length. That distinction carries weight because a straight line drawn between the Valloire church square at 1,412 m and the Galibier summit at 2,634 m would return a considerably shorter figure. The road does not travel in a straight line; it works up the Valloirette valley, negotiates the Plan Lachat plateau, and then switches back through the upper amphitheatre before the tunnel and the final ramp above.
OSRM adds up the length of every OSM segment the road passes through, from the moment the rider crosses the notional start in Valloire until the coordinates match the summit marker. 18.37 kilometres is the sum of those segments. It is the number a bike computer should report at the top, give or take the accuracy of the rider's GPS trace and whether they zeroed at the exact same start.
Different sources give slightly different figures for the same ascent. That is not a scandal — it is what happens when different measurement bases meet the same mountain. Some road books measure from the last building of Valloire rather than the church, adding a few hundred metres. Some stop at the tunnel entrance rather than the col itself, taking a few hundred off. When we say 18.37 km, we mean OSRM's sum from the Valloire start coordinate to the summit coordinate, on the road as OSM currently draws it.
The profile print is scaled to that length. If the ground truth were 18.6 km, the drawing would need to be redrawn — every gradient bin, every hairpin marker, every kilometre gridline would shift. Getting the horizontal axis right is the foundation of every vertical claim on top of it.
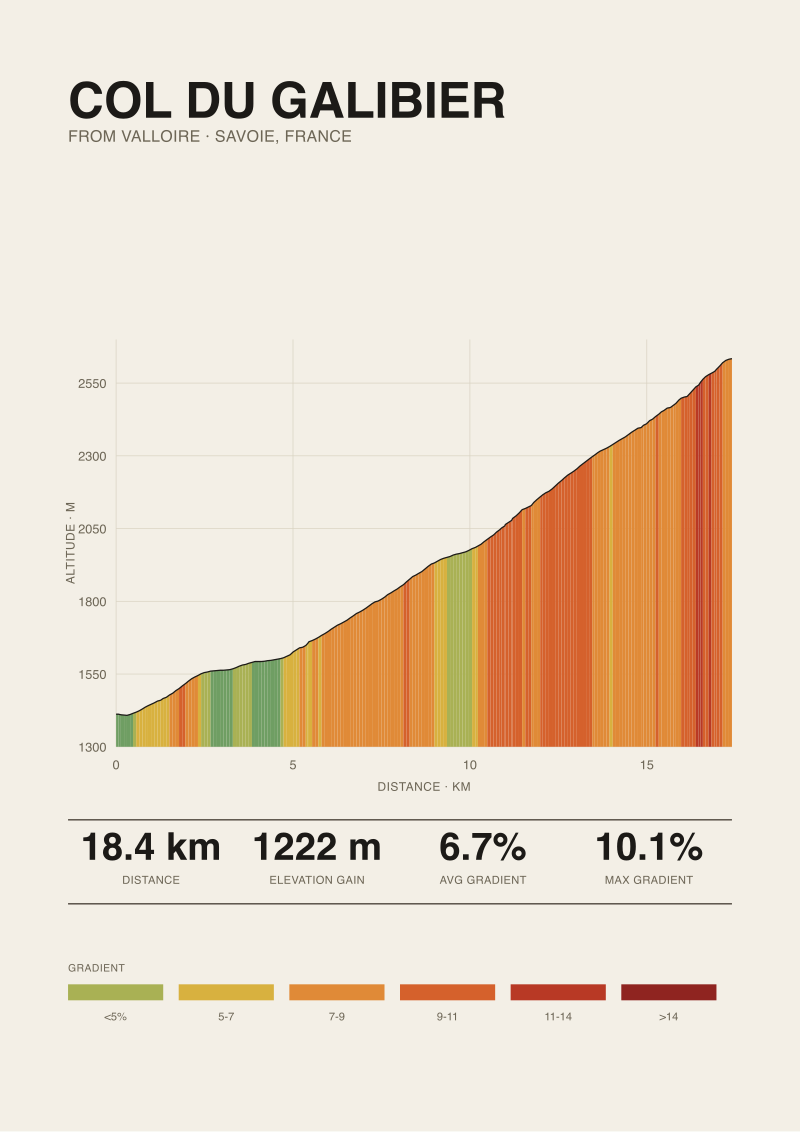 Col du Galibier
The print from this article · from €29.95
View the print →
Col du Galibier
The print from this article · from €29.95
View the print →
Finding #2: 1,222 m of Gain Between 1,412 m and 2,634 m
The vertical is where the mountain lives. From 1,412 m at Valloire to 2,634 m at the summit, the ascent gains 1,222 metres of elevation. That number is not the sum of every upward jitter along the route — it is the clean delta between start and summit as SRTM 30 m reads them.
There is a reason we take the delta rather than the accumulated positive gradient. On a real road, small dips are common: a river crossing, a levelled village square, a hairpin that briefly plateaus before the next ramp. If you sum every positive step and ignore every negative one, you inflate the total. That inflated figure has a name in cycling databases, and it is often what shows up on Strava as "elevation gain". It is useful for training load, but it is a lie for climb geometry.
The Galibier from Valloire is not a route with meaningful net descent inside it — the road climbs from the start. The delta and the accumulated positive gain converge closely. We report 1,222 m because the two endpoints, 1,412 and 2,634, are the honest anchors, and because a print of a climb is a story of two altitudes.
Those altitudes place the ascent squarely in the high-altitude tier of European road climbs. Above 2,000 m the air noticeably thins; above 2,500 m, sea-level riders feel it in every third pedal stroke. The last 634 vertical metres of this climb sit in that zone. The print shows that visually, with the altitude scale calibrated so that the reader's eye can find 2,000 m and 2,500 m without hunting.
Finding #3: The 6.7% Average Hides the 10.1% Published Max
An average gradient of 6.7% sounds moderate. Divide 1,222 m of gain by 18.37 km of length and the arithmetic is unambiguous: 6.65%, rounded to one decimal. That is the number that goes on the print. It is also the number that mostly misleads riders planning their first attempt on the col.
The published maximum gradient for the Valloire side, as recorded by climbfinder.com, is 10.1%. That is a ramp of measurable length, not a single steep pixel on a profile. Between the moderate opening kilometres out of Valloire and the shallow-then-steep upper section, there are stretches where the road demands double-digit percentages for hundreds of metres at a time. A rider who trains on a 6.7% simulation and expects the mountain to feel like that will be surprised at Plan Lachat and again in the last three kilometres.
The gap between 6.7% and 10.1% is the entire argument for measuring rather than averaging. Any climb long enough to have geography inside it — a valley opening, a plateau, an amphitheatre, a summit ramp — will have gradient variance that a single number cannot describe. The average tells you the work per kilometre if the climb were made of one continuous ramp. It is not made of one continuous ramp.
We keep both numbers on the print for that reason. 6.7% goes in the header, because it is the honest headline. The profile drawing itself, with its gradient-shaded segments, is where the 10.1% zones show up as darker bands. A reader who can read a profile does not need the maximum in words; they will find it with their finger on the print.
Finding #4: Where Our Profile Disagrees With the Road Book
Our profile and the published road book agree on the endpoints and disagree, sometimes, on what happens between them. That disagreement is worth naming because it is where measurement gets interesting.
The published maximum gradient of 10.1% comes from climbfinder.com's Valloire entry. Climbfinder builds its figures on a mix of sources including user-submitted rides and its own elevation queries. Our maximum, taken from SRTM 30 m sampled along the OSRM route, sits close to that figure but is not necessarily identical to the exact tenth of a percent. Two different elevation datasets, sampled at two different resolutions, will produce slightly different short-segment gradients even on the same road.
The place this matters is the short, sharpest ramp. If a road book records 10.1% over a 100-metre section and the SRTM raster smooths that same section to 9.6% because its 30-metre resolution cannot resolve the peak, both figures are correct to their own definitions. The road book captures a sharper truth over a smaller window; the raster captures a smoother truth over a larger one. Neither is a hallucination. They are two honest lenses on the same asphalt.
This is why our print names the published max as a separate figure with its source attributed. We are not overwriting climbfinder's number with ours; we are placing it next to ours so the reader can see both. That is a habit that comes from working with elevation data long enough to know it is a model, not a ground truth. The ground truth is the road, and the road does not publish itself.
Galibier from Valloire: Measurement Summary
| Metric | Our Value | Basis | Source |
|---|---|---|---|
| Length | 18.37 km | Routed distance | OSRM on OSM |
| Elevation gain | 1,222 m | Delta between endpoints | OpenTopoData SRTM 30 m |
| Start elevation | 1,412 m | Valloire coordinate | OpenTopoData SRTM 30 m |
| Summit elevation | 2,634 m | Summit coordinate | OpenTopoData SRTM 30 m |
| Average gradient | 6.7% | 1,222 m / 18.37 km | Derived |
| Maximum gradient | 10.1% (published) | Road-book figure | climbfinder.com |
What This Does NOT Prove
None of the above proves that the road is exactly 18.37 km long to the metre, or that the highest ramp is exactly 10.1% and not 10.2% or 9.9%. What we have produced is a coherent measurement — a set of numbers that agree with each other, are traceable to specific sources, and behave sensibly when checked against the eight anchor points along the route. Coherence is not the same as absolute precision.
Nor does the measurement capture what it feels like to ride the Galibier. Wind, altitude, road surface, temperature and the state of the rider's legs are all outside the scope of an elevation-and-routing model. A profile drawn from SRTM and OSRM is a geometry, not an experience. It is meant to inform preparation and reward the eye, not to substitute for the climb itself. When we hang a Galibier print on a wall, we are hanging the mountain's shape, not its weather.
The Takeaway
18.37 kilometres, 1,222 metres of gain, 6.7% average, 10.1% published max — measured with SRTM and OSRM, checked at eight anchors, and drawn only after the numbers agreed. A Galibier print from our shop is exactly what those measurements produce on paper.
FAQ
What is SRTM 30 m and why is it used for climb profiles?
SRTM 30 m refers to the Shuttle Radar Topography Mission elevation model resampled to roughly one sample per thirty horizontal metres. It is a global raster of ground elevation derived from radar interferometry. For climb profiles it is used because it is consistent, free, and covers every mountain in Europe with the same method. The trade-off is resolution: a 30 m grid smooths features shorter than that, which affects the exact peak-gradient number but not the overall shape of the ascent.
Why does the average gradient differ from what my bike computer shows?
A bike computer records accumulated positive elevation gain, adding every upward step it detects and ignoring downward ones. Our 6.7% average uses the clean delta between the Valloire start at 1,412 m and the summit at 2,634 m, divided by the 18.37 km routed length. On a road with any downhill jitter or GPS noise, the bike-computer method inflates gain and, therefore, inflates average gradient. Both numbers are internally consistent; they measure different things.
Is 10.1% really the steepest part of the Valloire side?
10.1% is the published maximum recorded by climbfinder.com for the Valloire ascent, and it is the figure we cite on the print because it comes from a road-focused source rather than a smoothed raster. SRTM 30 m sampling along the same road tends to blur the sharpest 100-metre ramps, so an elevation-model max can read a few tenths lower. In practice, the steepest stretches sit in the upper section above Plan Lachat and in the final kilometres near the summit.
What does OSRM add that a simple map distance would not?
OSRM computes routed distance along the actual road graph, following every bend, hairpin and switchback as OpenStreetMap has them drawn. A map-flat straight line between Valloire and the summit would return a substantially shorter figure because it ignores geometry. The 18.37 km on our print is what a rider's odometer should read at the top, allowing for GPS trace error and any difference in where the start is defined. Without OSRM the horizontal axis of the profile would be arbitrary.
Why check eight sample points instead of one or a hundred?
The eight anchors are an audit, not the drawing resolution. One anchor tells you nothing about consistency. A hundred anchors is overkill when the underlying raster is already 30-metre resolution. Eight points distributed between 1,412 m and 2,634 m give us a spread across the valley, the plateau and the summit amphitheatre — enough to catch a systemic drift between OSRM's coordinates and SRTM's elevations without turning the check into a second full measurement pass.
Does the Climb Prints profile match what I will see on Strava?
Closely, but not identically. Strava segments have their own start and end points, defined by whoever created the segment, and their elevation is smoothed by Strava's own model. Our profile uses fixed coordinates for Valloire and the Galibier summit and reads elevation from SRTM 30 m without additional smoothing. Expect agreement within a small margin on total length and gain, and small differences on any single steep sub-section — the differences are method, not error.
Can this method be applied to any European climb?
Yes, with caveats. OSRM works wherever OpenStreetMap coverage is good, which is essentially all of Europe's paved road network. SRTM 30 m covers the continent uniformly. The method breaks down on very short, very sharp ramps (where 30-metre resolution smooths the peak) and on climbs where the road is poorly mapped in OSM. For the classic cols of the Alps, Pyrenees, Dolomites and Mallorca, the workflow is directly transferable — which is why our catalogue is built the way it is.
Where can I see the finished Galibier print?
The measured profile is drawn to scale, with altitude and distance calibrated so the eye reads the ascent the way a rider experiences it — moderate opening kilometres, the Plan Lachat break, the steeper upper amphitheatre, the final ramp to 2,634 m. It lives in our shop alongside the other cols we have measured. Every print carries the same header data as this article: length, gain, average gradient, published max, and the sources behind each figure.
From the collection



New climbs and 10% off your first print.
One email now with your code. No noise after.