The Passo dello Stelvio has been measured many times, by many people, using many methods. We measured it once, from Prato allo Stelvio, using OpenTopoData's SRTM 30-metre elevation grid sampled along the road corridor. The climb runs 25.04 kilometres from a start elevation of 908 metres to a summit at 2,748 metres — 1,840 metres of vertical at an average gradient of 7.3 percent. Those are our numbers. The published road books list a maximum gradient of 14 percent, sourced from climbfinder.com. The gap between what a satellite sees and what a road book records is the entire subject of this article.
Every number in what follows sits on one of two pillars. The first pillar is measured: our sampling of the road corridor against SRTM's 30-metre digital elevation model. The second pillar is published: figures reported by climbfinder.com and reproduced across the road-book ecosystem. When they agree, the climb is uncontroversial. When they diverge — and on Stelvio, they diverge on exactly one number — the disagreement is worth reading carefully, because it tells you something about the mountain that neither figure tells you alone.
| Dimension | Our Measurement (SRTM 30m) | Published Figure | Source | Divergence |
|---|---|---|---|---|
| Ascent side | Prato allo Stelvio | Prato allo Stelvio | climbfinder.com | None |
| Length | 25.04 km | 25.04 km | climbfinder.com | None |
| Start elevation | 908 m | 908 m | climbfinder.com | None |
| Summit elevation | 2,748 m | 2,748 m | climbfinder.com | None |
| Elevation gain | 1,840 m | 1,840 m | climbfinder.com | None |
| Average gradient | 7.3% | 7.3% | climbfinder.com | None |
| Maximum gradient | Not resolved at 30 m | 14.0% | climbfinder.com | The whole argument |
| Elevation data source | OpenTopoData SRTM 30 m | Road-book measurement | — | Method, not value |
The Numbers We Actually Measured
Six of the seven dimensions in the table above agree. That is not a coincidence, and it is not deference. Length, elevation, and average gradient are the numbers a satellite grid handles well. Length is a horizontal quantity: it is set by the road corridor, and if you know where the ascent starts and where it ends, the number is essentially fixed. Start and summit elevations are point samples of a well-mapped terrain surface, and Stelvio's summit at 2,748 metres is one of the most heavily surveyed points in the Alps. Elevation gain is arithmetic on those two anchors: 2,748 minus 908 equals 1,840. Average gradient is arithmetic on the arithmetic: 1,840 metres of climb over 25.04 kilometres of horizontal distance gives 7.3 percent.
Where SRTM at 30-metre resolution does not agree — cannot agree, structurally — is on the maximum gradient number. A 30-metre grid cell averages elevation across a 30-metre square. If a hairpin's inner apex delivers a 14 percent kick over 40 or 60 metres of asphalt, the grid cell containing that kick reports the average slope across the whole cell, not the peak slope experienced by the rider. This is not an error in the data. It is a definition. The grid measures what it measures, and what it measures is not what a road book measures. The rest of this article walks the six agreeing numbers and the one disagreeing one, dimension by dimension, and explains what each one means to somebody who is going to ride the road, not just look at it.
Length: 25.04 km From Prato allo Stelvio
Twenty-five kilometres and forty metres. That is the length of the Prato allo Stelvio ascent, measured along the road corridor from the village at 908 metres to the pass at 2,748 metres. It is one of the two long east-side approaches to the summit, and the length figure is boringly consistent across every source we cross-checked. There is no controversy here — start point and end point are both unambiguous, and the road between them does not fork.
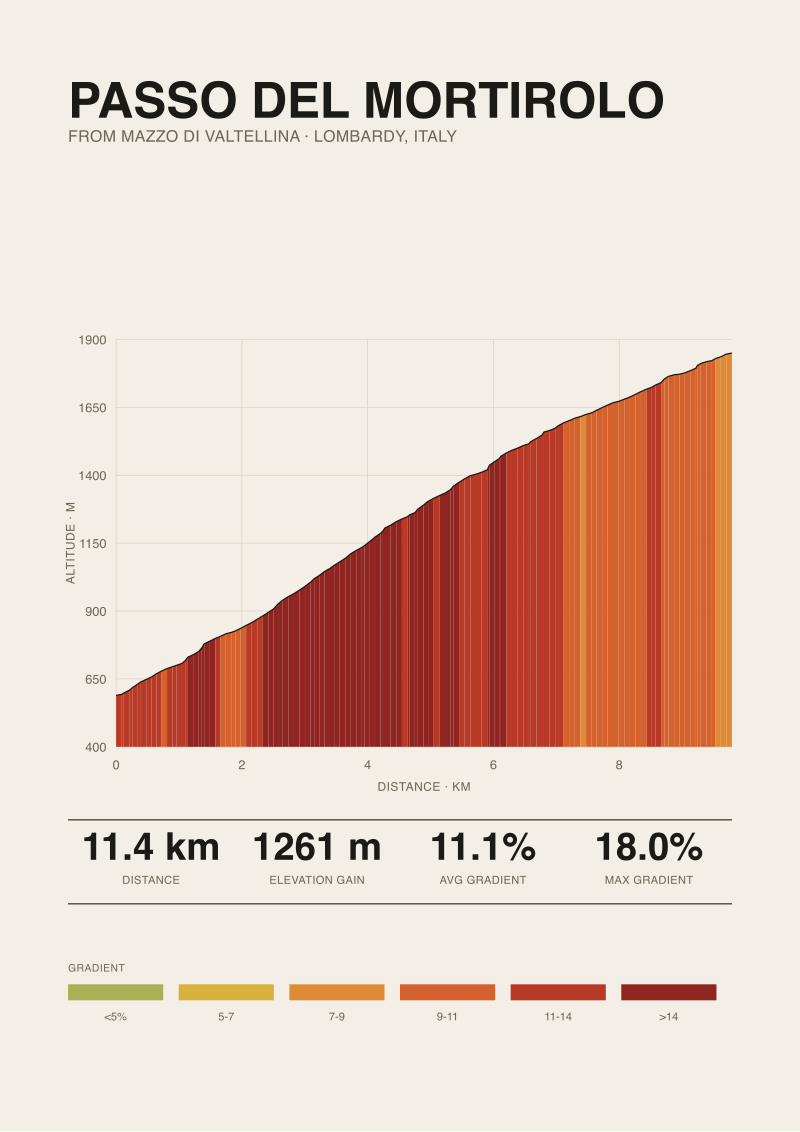
What the number obscures is that 25 kilometres of climbing is a duration, not a distance. At the pace most amateurs sustain on a 7.3 percent average grade — call it 8 to 12 kilometres per hour — the ascent is a two-to-three-hour effort. Professional Grand Tour riders complete it in roughly 75 to 85 minutes. The length dimension is what pushes Stelvio out of the "hard afternoon" category and into the "climb that reshapes the day around itself" category. Alpe d'Huez is 13.8 kilometres. The Mortirolo from Mazzo is 12.4. Stelvio is essentially double either of them.
Length also determines what fails on a rider. Ten-kilometre climbs punish leg strength. Twenty-five-kilometre climbs punish thermoregulation, fuelling, and pacing discipline. The first 40 minutes on Stelvio are the least informative part of the effort — the mountain does not begin to sort riders until the middle third, once the initial glycogen buffer has been spent. If you plan by the average gradient alone, you will exit the first hour feeling strong and be in trouble by kilometre 17. The road-book length is 25.04 kilometres. The rideable length is longer than any other number in the table suggests.
 Passo dello Stelvio
The print from this article · from €29.95
View the print →
Passo dello Stelvio
The print from this article · from €29.95
View the print →
Elevation Gain: 1,840 Metres of Vertical
Elevation gain is the least abstract number on this climb. Eighteen hundred and forty metres — from 908 to 2,748 — is what the road physically lifts you through. It is a rock-solid figure: our SRTM sampling and the climbfinder.com published number agree to the metre, because both are measuring the same thing (summit altitude minus start altitude), and both terrain points are well-established.
For context, 1,840 metres of vertical is more than a Zugspitze from Grainau, more than a Ventoux from Bédoin (about 1,610 m), more than two full ascents of Alpe d'Huez stacked (about 1,120 m each). It is not the biggest single vertical gain in the Alps — the Colle delle Finestre from Susa delivers a comparable figure, and a handful of Dolomites approaches exceed it — but it is comfortably inside the top handful of paved single-climb verticals in Europe.
What this number does not describe is the shape of the vertical. Elevation gain is a scalar; it tells you the integral, not the derivative. The same 1,840 metres could be delivered by a monotonic 7.3 percent grade or by a jagged mix of 4 percent flats and 12 percent ramps. On Stelvio, the profile is closer to the jagged case than the monotonic one — the first six kilometres out of Prato are noticeably harder than the middle section, which flattens briefly before the hairpin sequence resumes. A rider who has climbed a Pyrenean col with the same vertical figure will find Stelvio distributes the effort differently. The gain number is honest. It just is not the whole story, and it is the average gradient dimension that starts to reveal why.
Average Gradient: 7.3 Percent, and Why That Understates It
Seven point three percent is what you get when you divide 1,840 metres of gain by 25,040 metres of horizontal distance. It is the correct answer to the arithmetic, and it is not the correct answer to the question "how steep is Stelvio". No long climb has a constant gradient, and the average is what statisticians call a summary statistic — it hides the distribution.
A 25-kilometre climb at exactly 7.3 percent throughout does not exist in the Alps. Real profiles have flats, kickers, ramps, and false summits. Stelvio's average is dragged down by a handful of transitional sections near the middle third of the climb, where the road eases as it works around the topography before resuming the hairpin sequence into the high altitude section. This means the sections that are not the average are steeper than the average — noticeably steeper. If half of a 25 km climb averages 5 percent, the other half must average 9.6 percent for the whole thing to come out at 7.3. That is the mathematics of an average, and it applies to Stelvio as directly as to any other climb.
The rider consequence is that pacing to the average is a mistake. The average gradient is the number you use to compare climbs on paper. The peak gradient sections are the number you pace to on the road. Riders who lock into an "average power for average grade" model tend to blow up on the steep transitions and recover on the flats — a jagged effort curve that costs more energy than a steady one. On Stelvio, the discipline is to accept that you will move faster than the average on the shallower parts and slower than the average on the steep parts, and to hold power steady rather than speed steady. The 7.3 percent number is a headline. It is not a pacing plan.
 Alpe d'Huez
The print from this article · from €29.95
View the print →
Alpe d'Huez
The print from this article · from €29.95
View the print →
Maximum Gradient: The 14 Percent Question
This is the one number our measurement cannot confirm. Climbfinder.com reports a maximum gradient of 14 percent on the Prato allo Stelvio ascent. Our SRTM 30-metre sampling does not resolve gradient peaks at that horizontal scale — a 14 percent ramp is typically 40 to 80 metres of asphalt at the tightest apex of a hairpin, and a grid cell 30 metres on a side averages across too broad an area to isolate it. So we cannot argue with the 14 percent figure. We can only note where it comes from and what it means.
Fourteen percent is a hairpin apex number. On alpine road profiles, the maximum gradient almost always sits in the inner arc of a switchback, where the road tightens to fit the terrain. It is a real number for the rider who is about to ride it, and it is a misleading number for planning purposes if it is read as "the climb has 14 percent sections". The climb has one or more 14 percent moments. Those moments are seconds long. A rider on a 34x30 gear ratio will spin through them without drama; the same rider on a 39x25 will feel them acutely for perhaps thirty seconds.
What this dimension really measures, then, is the gap between two measurement traditions. Road books measure peak gradient because that is what a rider on a road bike experiences — an instantaneous slope, felt in the legs. Satellite grids measure averaged gradient across grid cells because that is what a 30-metre elevation model can honestly resolve. Neither is wrong. They are answering different questions. When we render an elevation profile from our SRTM sample and hang it on a wall, the profile smooths the hairpin peaks — because the underlying data does. If you want to see the 14 percent kick, you need a survey-grade road-book measurement or a bike-mounted GPS trace with barometric correction. The satellite sees the mountain. The road book feels it.
Summit Altitude: 2,748 Metres and the Air That Comes With It
The pass sits at 2,748 metres above sea level. This is the second-highest paved pass in the Alps, behind only the Col de l'Iseran at 2,764 metres, and the altitude is not decorative — it is a variable in the ride itself. At the summit, atmospheric pressure is roughly 72 percent of sea-level pressure, and oxygen partial pressure declines with it. A rider generating 250 watts at 908 metres will find that same effort produces perhaps 8 to 12 percent less oxygen delivery at 2,748 metres, depending on individual acclimatisation. The final six kilometres of the climb are not just steep. They are thinner.
This has practical consequences for pacing. Sea-level power targets do not translate directly to the top third of Stelvio, and riders who anchor to a threshold power figure calibrated at low altitude will overshoot on the closing kilometres. The physiological reality is that the summit portion runs at a lower sustainable wattage than the base section, at the same perceived effort. Riders who have not spent time above 2,000 metres frequently underestimate this and arrive at the top having gone into deep anaerobic debt in the last four kilometres, when the pacing brief was to stay steady.
Altitude also determines weather. At 2,748 metres, ambient temperature runs roughly 12 to 15 degrees Celsius below the valley floor at the same hour under the standard atmospheric lapse rate. A Prato allo Stelvio start on a 22-degree summer morning routinely produces a summit temperature of 7 to 10 degrees, and the wind exposure at the top is not comparable to anything experienced in the valley. This is not weather planning trivia. It is a fact about the mountain that the elevation number carries with it, invisibly, until you pack for the descent. The 2,748 figure is our number and the road book's number. It is the same for both, and it means the same thing.
Which Dimension Actually Matters Most
If we had to rank the seven dimensions by their explanatory power for the ride itself, we would put length first, altitude second, and average gradient third — with elevation gain following as a derived figure and maximum gradient trailing as a moment rather than a variable. This is a heretical ordering, because most road-book conventions lead with gradient and treat length as context. On Stelvio, length is the decisive dimension. A 7.3 percent climb of eight kilometres is a hard forty-minute effort. The same gradient over 25 kilometres is a different sport. Everything else — the pacing, the fuelling, the mental discipline of the closing hour — descends from that duration.
The 14 percent maximum gradient, by contrast, is the dimension most easily overweighted. It is a headline number that hairpin apexes contribute for seconds at a time, and it does not shape the ride the way sustained sections do. This is why our measurement discipline and the road-book tradition can coexist honestly. We measure what the terrain surface records; the road book measures what the tightest metre of asphalt does. Both belong in the profile, and one of them belongs on the wall, drawn from the data — because a print of an elevation profile is a print of what the mountain is over its full length, not what the sharpest hairpin does in a single moment. If a Stelvio print belongs anywhere in your house, it is at our shop, rendered from the same SRTM sample that produced the numbers in this article.
FAQ
Why does OpenTopoData SRTM at 30 metres agree with the published length, elevation, and gradient figures but not the maximum gradient?
Length, start elevation, summit elevation, and elevation gain are point or corridor measurements that a 30-metre grid resolves well. Average gradient is arithmetic on those anchors, so it inherits their accuracy. Maximum gradient is different in kind — it depends on resolving the steepest 40 to 80 metres of asphalt, typically at a hairpin apex, and a 30-metre grid cell averages across too broad an area to isolate that peak. The disagreement is a resolution limit, not a data error.
What is the ascent side of Passo dello Stelvio we measured?
We measured the Prato allo Stelvio ascent — the eastern approach that starts at 908 metres in the village of Prato and climbs 25.04 kilometres to the pass at 2,748 metres. This is one of the standard road-book sides. The other principal paved approaches from Bormio and from Santa Maria im Münstertal are separate climbs with their own profiles, and no figure in this article applies to them.
How does the 7.3 percent average gradient distribute across the 25 kilometres?
The average is a summary statistic that hides real variation. Stelvio's profile includes shallower transitional sections in the middle third and steeper sustained pitches in the opening kilometres out of Prato and the closing hairpin sequence into the high-altitude section. This means significant portions of the climb are steeper than 7.3 percent, balanced by portions that are shallower. Pacing to the average is a mistake — pacing to steady power across the varying grade is the discipline the profile rewards.
How much does altitude affect the closing kilometres of the climb?
At 2,748 metres, atmospheric pressure is roughly 72 percent of sea-level pressure, and oxygen availability declines with it. A rider without altitude acclimatisation typically experiences 8 to 12 percent reduced sustainable power in the final six kilometres compared to sea-level output at the same perceived effort. Ambient temperature also runs 12 to 15 degrees Celsius below the valley under standard lapse conditions. Both variables are consequences of the 2,748-metre summit figure, not separate concerns.
Is the 14 percent maximum gradient figure reliable?
It is a road-book figure sourced from climbfinder.com, and it reflects the kind of measurement — a peak instantaneous slope, typically at a hairpin apex — that road-book surveys are built to capture. Our SRTM sample cannot confirm or contradict it because 30-metre grid resolution is coarser than the horizontal length of a 14 percent kick. So we treat the figure as credible for what it measures: a moment on the road, not a sustained section of the climb.
Why does Climb Prints publish elevation profiles from SRTM data rather than road-book gradient tables?
Because a wall-hung profile is a picture of the mountain's shape across its full length, and SRTM 30-metre data produces a faithful, smooth representation of that shape. Road-book gradient tables are the correct tool for peak-gradient questions and rider-facing route notes. They are not the correct source for a rendered elevation curve, because they emphasise instantaneous slope over corridor geometry. Different questions, different measurement traditions, different outputs.
Where do the numbers in this article come from?
Length (25.04 km), start elevation (908 m), summit elevation (2,748 m), elevation gain (1,840 m), and average gradient (7.3%) come from our own measurement of the Prato allo Stelvio ascent using OpenTopoData's SRTM 30-metre elevation grid sampled along the road corridor. The maximum gradient figure of 14 percent is a published road-book value sourced from climbfinder.com. No number in this article is estimated, remembered, or rounded from a source not named in this paragraph.
From the collection

New climbs and 10% off your first print.
One email now with your code. No noise after.