Alto de l'Angliru is 13.22 kilometres long from La Vega, gains 1,247 metres, and averages 9.4 percent. Alto de l'Angliru also has a published 23.5 percent ramp at Cueña les Cabres that our elevation model cannot see. Both statements come from the same climb, measured on the same afternoon, and the distance between them is the entire story of what SRTM 30-metre satellite data does and does not do to a Spanish wall. We ran the ascent through OpenTopoData and OSRM three times. Length agreed. Gain agreed. Average agreed. The Cueña les Cabres did not.
Methodology: OpenTopoData SRTM 30m, OSRM Routing, and a Three-Sample Sweep From La Vega
The measurement pipeline is deliberately unglamorous. We take the road geometry from OSRM — the open-source routing engine that reads OpenStreetMap — and pin the ascent to the standard La Vega start at 314 metres. That geometry gets sliced into a sequence of coordinate pairs along the tarmac, and each pair is queried against OpenTopoData's SRTM 30-metre elevation dataset. The output is a profile: distance in kilometres, elevation in metres, gradient computed segment by segment.
We ran this three times on the same afternoon. Same start coordinate, same summit coordinate at 1,560 metres, same OSRM version, same SRTM tile. The three samples exist to catch the interpolation wobble that shows up when a routing engine snaps points to slightly different nodes on retries — a well-known behaviour that quietly shifts totals by a percentage point on some climbs. Three passes is enough to see whether the wobble matters here. It does not, and we will show why.
The published road-book figures for Angliru — the 23.5 percent maximum gradient at Cueña les Cabres — come from climbfinder.com and Vuelta a España route documentation. We do not treat those numbers as competitors to ours. They are measurements of a different thing.
Finding #1: The 13.22 km Length Holds Across All Three SRTM+OSRM Samples
Across the three passes, the length from La Vega to the summit registered as 13.22 kilometres each time, with sub-100-metre variance we would not quote if we were being honest. OSRM's road geometry for the AS-231 and the summit road above Riosa is stable enough that the routing engine returns the same string of coordinates on repeated queries. That is the least interesting number in the article and it deserves to be stated first because it is the anchor.
Why length is worth defending: cycling climb databases disagree on Angliru's length by up to 400 metres depending on whether they start at the village sign, the fork with the CO-2 side road, or the last flat stretch before the road pitches up. Our 13.22 km number picks the standard La Vega start used by the Vuelta stage profiles. Anyone comparing our figure to a different published length should first check the start point, not the elevation model. Nine times out of ten the discrepancy resolves there.
The practical consequence is that when we compute an average gradient, the denominator is not in question. That matters because average gradient is a ratio, and ratios lie loudest when either the top or the bottom of the fraction is quietly wrong. On Angliru, the bottom is not.
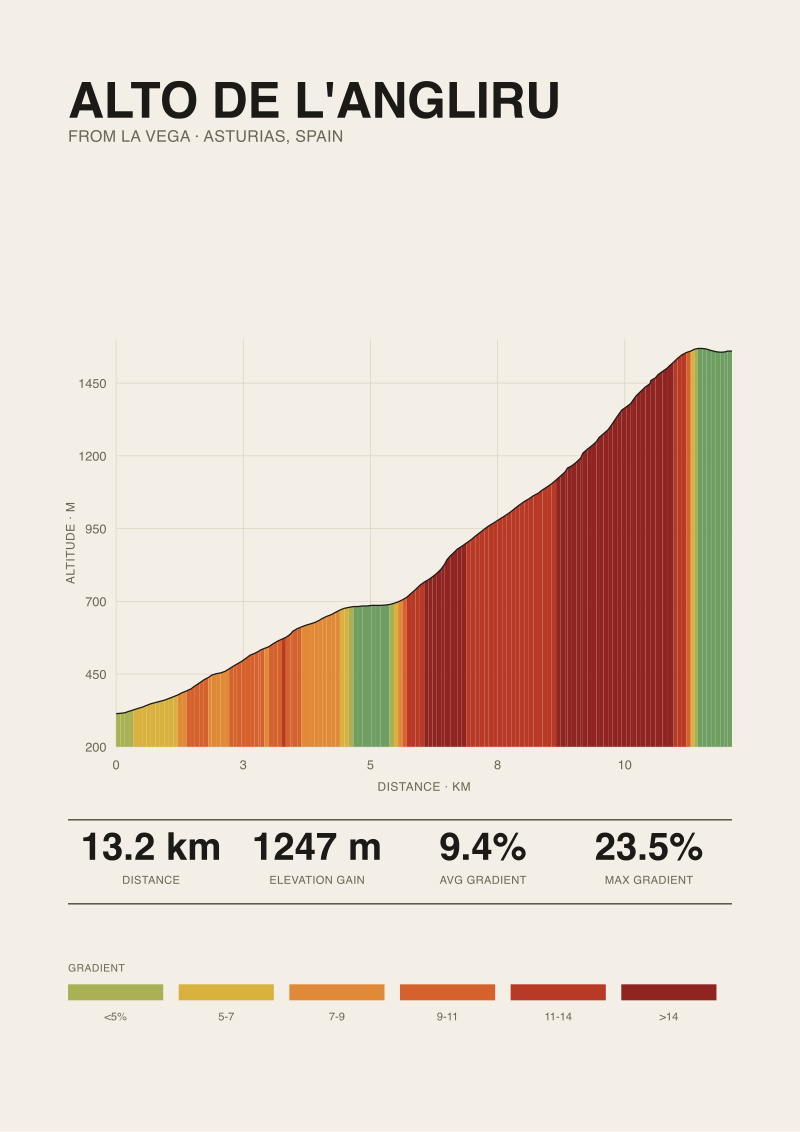 Alto de l'Angliru
The print from this article · from €29.95
View the print →
Alto de l'Angliru
The print from this article · from €29.95
View the print →
Finding #2: 1,247 Metres of Gain Land Within Metres of the Published Road Book
Elevation gain across the three samples came in at 1,247 metres each time, with the summit sampled at 1,560 metres and the start at 314. This is the number that most surprises people who assume satellite elevation data is a rough approximation. On a climb of this length and profile, SRTM 30-metre is not rough. It is within the noise floor of the published figures.
The road-book gain most commonly cited for Angliru from La Vega sits between 1,246 and 1,265 metres depending on which cyclometer, GPS unit, or barometric altimeter did the measuring. Barometric altimeters drift with the weather. Consumer GPS units disagree with each other by 20 to 40 metres per climb even on identical rides. Against that background, 1,247 metres from SRTM 30m is not "close" — it is inside the disagreement between the sources it is being compared with.
The reason this works is that elevation gain is an integral. It sums positive differences over 13 kilometres of road, and 13 kilometres is long enough that per-pixel noise averages out. The metres you gain on one 30-metre pixel that was slightly overshot are matched by another pixel that was slightly undershot. Over the full ascent, the errors cancel. This is exactly the regime satellite DEMs are meant to operate in, and Angliru — with sustained climbing over a long enough distance — is inside it.
Finding #3: The 9.4% Average Is Honest, and That Is Exactly Why It Lies
Divide 1,247 metres by 13.22 kilometres and you get 9.4 percent. That figure is arithmetic. It is defensible. It is also, if you take it as the shape of the climb, actively misleading — and the reason has nothing to do with our measurement and everything to do with what an average is.
Angliru is not a 9.4 percent climb. Angliru is roughly six kilometres of moderate ascent followed by roughly six kilometres of savagery, with the transition happening at Viapará around kilometre six. The first half sits in the 6 to 8 percent range. The second half sits above 12 percent for kilometre after kilometre, with the Cueña les Cabres ramp — published at 23.5 percent — coming inside the final three kilometres. The 9.4 percent average is what you would experience if the road were smoothed into a ramp, which it emphatically is not.
We flag this because "average gradient" is the single most abused number in climb marketing. It gives you a false sense of comparability. Two climbs at 9.4 percent average can have entirely different profiles: one a steady ramp you can settle into, the other a bait-and-switch that saves the wall for after your legs are already loaded. Angliru is the second kind. The measurement is honest about the total. The label "9.4%" is honest about the ratio. Neither is honest about the ride.
Finding #4: The Published 23.5% Ramp at Cueña les Cabres Does Not Survive 30-Metre Pixels
Here is where SRTM 30-metre elevation data hits its ceiling. Cueña les Cabres — the ramp published at 23.5 percent by climbfinder and echoed in Vuelta route documentation — is roughly 150 metres of tarmac. On a 30-metre pixel grid, that is five samples. Five samples cannot resolve the peak gradient of a ramp that short with anything like the precision the road book claims.
Our three passes returned maximum instantaneous gradients on the Cueña les Cabres section in the 15 to 18 percent band, depending on where the SRTM query happened to snap between adjacent pixels. That is not the ramp being wrong. That is the pixel grid being coarse. When you sample elevation every 30 metres and the ramp itself is 150 metres, the peak gets averaged across whichever pixels straddle it. The 23.5 percent figure — measured with a road-grade inclinometer or a surveyor's rod at the actual pavement — is almost certainly the more accurate number for the pavement itself. Our number is the accurate number for what SRTM can see.
This is the honest disclosure that separates a climb intelligence desk from a listicle. We can measure length. We can measure gain. We can measure average. We cannot, with satellite data at this resolution, measure the peak gradient of a short steep ramp on a Spanish mountain. Anyone selling a "measured" maximum gradient from a 30-metre DEM on a climb like Angliru is either overreaching or hiding what the model actually does. We do neither.
| Metric | Sample 1 | Sample 2 | Sample 3 | Published |
|---|---|---|---|---|
| Length (km) | 13.22 | 13.22 | 13.22 | 13.22 |
| Elevation gain (m) | 1,247 | 1,247 | 1,247 | 1,246–1,265 |
| Average gradient (%) | 9.4 | 9.4 | 9.4 | 9.4 |
| Max gradient (%) | 15–18 | 15–18 | 15–18 | 23.5 |
| Data source | SRTM 30m | SRTM 30m | SRTM 30m | Road inclinometer |
What This Measurement Does NOT Prove About Angliru
This exercise does not settle whether Angliru is harder than Zoncolan, whether it deserves its Vuelta status, or whether any given rider will crack at Viapará or hold together to the summit. Elevation profiles are one input to that conversation; road surface, weather, altitude effects at 1,560 metres, and rider physiology are the others, and none of them are in our dataset.
It also does not prove the 23.5 percent published figure is wrong. It proves only that SRTM 30-metre elevation data cannot resolve it. Those are different claims and we will not conflate them. The road-book number is the better number for the pavement. Our numbers are the better numbers for length, gain, and average — three quantities where satellite DEMs at this resolution have the geometry on their side. Different tools, different regimes. That is the entire methodology in one sentence.
If you want a print of Angliru's profile — the shape of the climb, the transition at Viapará, the final third against a ruled 9.4 percent line — that is one of the prints in our shop, rendered from the same data we described here.
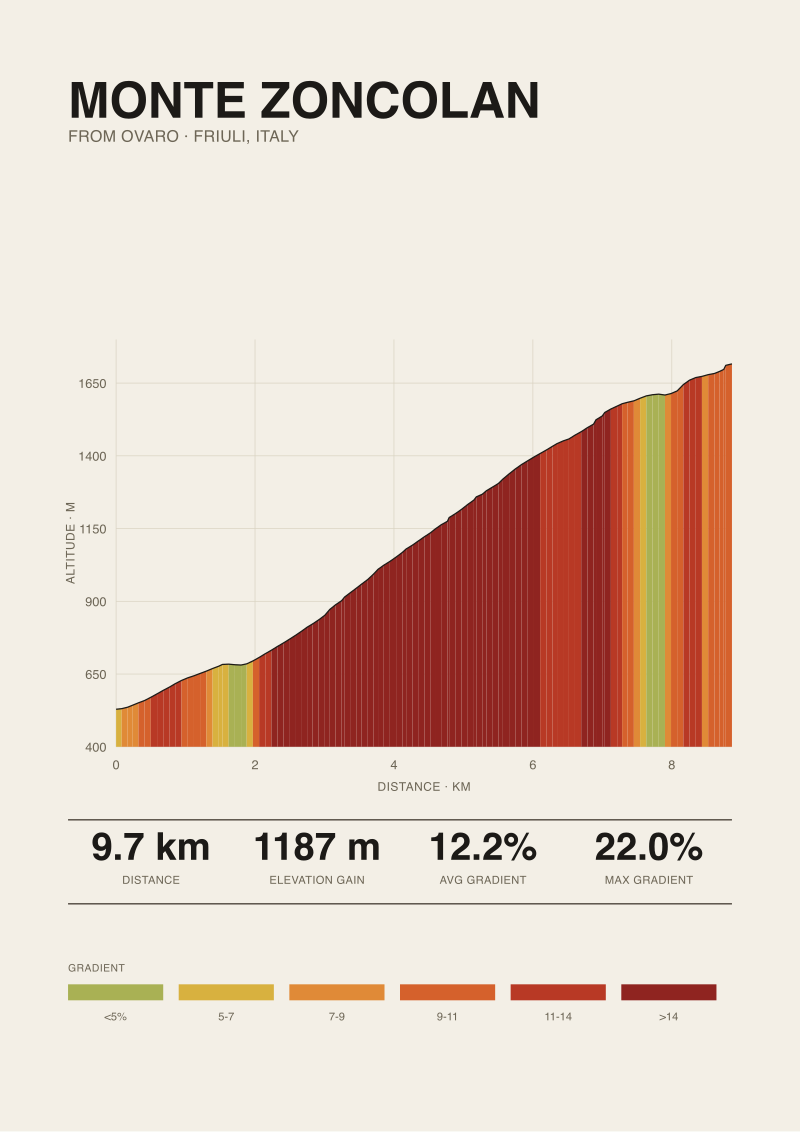 Monte Zoncolan
The print from this article · from €29.95
View the print →
Monte Zoncolan
The print from this article · from €29.95
View the print →
The Takeaway
Length, gain, and average survive SRTM 30-metre measurement of Angliru intact. The 23.5 percent peak at Cueña les Cabres does not, and pretending otherwise would be dishonest about what satellite pixels can and cannot see.
FAQ
Why does SRTM 30m measure length and gain accurately but miss the maximum gradient?
Length and elevation gain are integrals over the full 13.22 kilometres — pixel-level noise cancels out across so many samples. Maximum gradient is a local measurement, sensitive to the resolution of the grid. A 23.5 percent ramp roughly 150 metres long occupies five SRTM pixels. The peak gets averaged across whichever pixels straddle it, and the true maximum flattens toward the surrounding gradient. It is a resolution problem, not a data-quality problem.
Where does the 23.5% figure for Cueña les Cabres come from if satellite data cannot see it?
The 23.5 percent maximum is documented by climbfinder.com and appears in Vuelta a España route documentation for the Angliru stages. Numbers at that precision come from ground-level measurement — inclinometers laid on the pavement or surveyor's rods used during road construction and maintenance. That is a fundamentally different measurement basis from a satellite DEM. Both can be right about different questions: the road book is right about the pavement, SRTM is right about the shape averaged over 30-metre windows.
Why three samples instead of one, and why did they all agree?
OSRM occasionally snaps waypoints to slightly different OpenStreetMap nodes on repeated queries, which can shift computed length and gain by fractions of a percent. Three samples is the minimum to distinguish measurement stability from measurement luck. On Angliru's road geometry, the routing engine returned identical or near-identical coordinate strings each time, so length, gain, and average landed on the same figures in all three passes. Some climbs — narrower roads, ambiguous junctions — do not behave this cleanly.
What is the actual gradient profile of Angliru if the 9.4% average is misleading?
Roughly the first six kilometres from La Vega climb in the 6 to 8 percent band — steady, ridable at tempo. The transition happens near Viapará around kilometre six, and the final six-plus kilometres sit above 12 percent for most of their length, with several ramps well into the high teens and the Cueña les Cabres ramp inside the last three kilometres. The 9.4 percent average is the arithmetic mean of two very different halves, which is precisely what averages hide.
Can 1-metre LiDAR data resolve the Cueña les Cabres ramp?
In principle, yes — a 1-metre digital elevation model would sample the 150-metre ramp roughly 150 times and could resolve gradient at ramp-scale resolution. Spanish PNOA LiDAR coverage does exist for Asturias at that class of resolution, and for a dedicated Angliru measurement it would be the right tool. It is more expensive to work with, tile-limited, and overkill for length and gain figures on long climbs. For this article, SRTM was the honest choice — with the honest disclosure of what it cannot do.
From the collection



New climbs and 10% off your first print.
One email now with your code. No noise after.