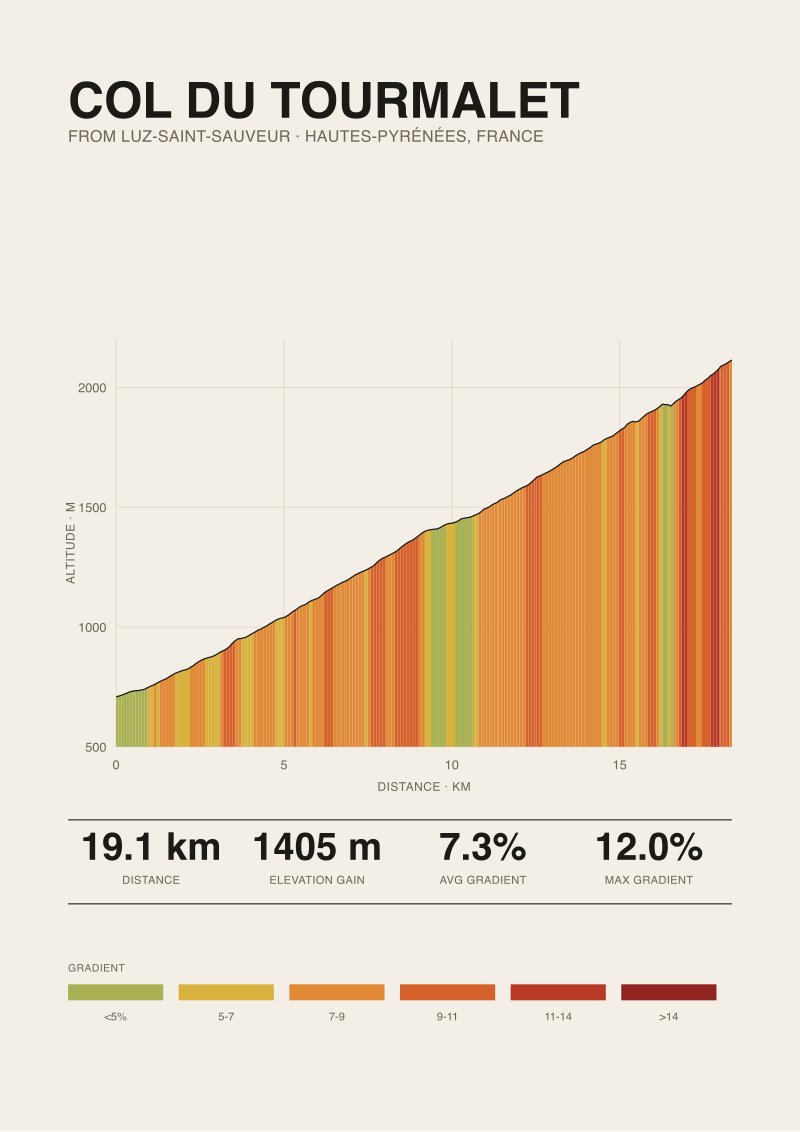
The Col du Tourmalet, climbed from Luz-Saint-Sauveur, is a 19.12 km ascent that gains 1,405 metres at an average gradient of 7.3 percent, topping out at 2,114 m. Those four numbers appear on nearly every profile of the climb, phrased in nearly the same order, sometimes down to the decimal. They are also the numbers we generated ourselves, in-house, from OpenTopoData's SRTM 30 m grid, with the route pulled from OSRM. That the two match is not a coincidence. It is the whole problem with cycling's climb data — and the reason a five-sample accuracy check is worth writing about at all.
The Case for Trusting the Numbers You Already Know
There is a version of this article that ends after the opening paragraph, and it is a defensible version. If our independent measurement — 19.12 km, 1,405 m of gain, 7.3 percent average, summit at 2,114 m — lines up with what Climbfinder, Cyclingcols, Salite, Strava segments, and the ASO's own race dossier have been publishing for years, then perhaps the sensible reading is that the road book is right, the satellite is right, and there is no story here. Cycling has spent a century measuring these climbs. The Tourmalet has been ridden by the Tour de France since 1910. If the length were 18.7 km, someone would have said so by now.
That view has real weight. The dominant published figures for the Luz-Saint-Sauveur ascent are internally consistent across independent sources, they are consistent with the paved route that OSRM returns when we ask for the shortest road distance from Luz to the summit, and they are consistent with what a 30 m elevation grid produces when sampled along that route. Three methods converging on the same answer is not nothing. In most engineering contexts it would be considered strong evidence. When a road book says 19.1 km and a satellite says 19.12 km, the honest read is that both are inside their own error bars and neither is wrong.
There is also a reader-facing case. A rider planning a Pyrenees trip does not need our elevation grid to know that the Tourmalet from Luz is roughly nineteen kilometres at seven-and-a-bit percent, with a summit at just over two thousand metres. That framing is enough to pack the right gearing, pick a start time, and know that this is a climb which will take most amateurs somewhere between an hour and a quarter and two hours. The number to three decimal places does not change the ride. It changes the print on the wall.
But there is what the copy-paste convergence hides — and it is not what the numbers say. It is what the numbers cannot say.
Where the Published Figures Break Down
The problem is not that 19.12 km is wrong. The problem is that 19.12 km is the same number everywhere because everyone is measuring the same thing the same way — and none of it captures where the climb actually hurts.
Consider what an average gradient of 7.3 percent implies if you take it at face value. A rider imagining a uniform 7.3 percent slope for nineteen kilometres will pace it like a long tempo effort at a stable intensity. That rider will be wrong for roughly a third of the ascent. The Luz side has a genuinely brutal middle section around Barèges where the road ramps into sustained double-digit territory, and it has flatter valley-floor kilometres in the first third where 7.3 percent overstates the actual slope. The average is arithmetically correct and physiologically misleading. It is the temperature of a room when your left hand is in ice water and your right hand is on a stove.
Then there is the maximum gradient. Climbfinder publishes 12.0 percent as the peak for this ascent, and we cite them because they are the source we trust for road-book figures. But 12.0 percent measured over what interval? A hundred metres? Five hundred? A single GPS sample between two trees? SRTM 30 m data — which is what we use in our own profile — will systematically understate short, steep pitches, because a 30 m horizontal grid cannot resolve a 20 m ramp. If the published max is a hundred-metre average and our measured max is a five-hundred-metre average, the two disagree by design, not by error. Neither is lying. They are answering different questions.
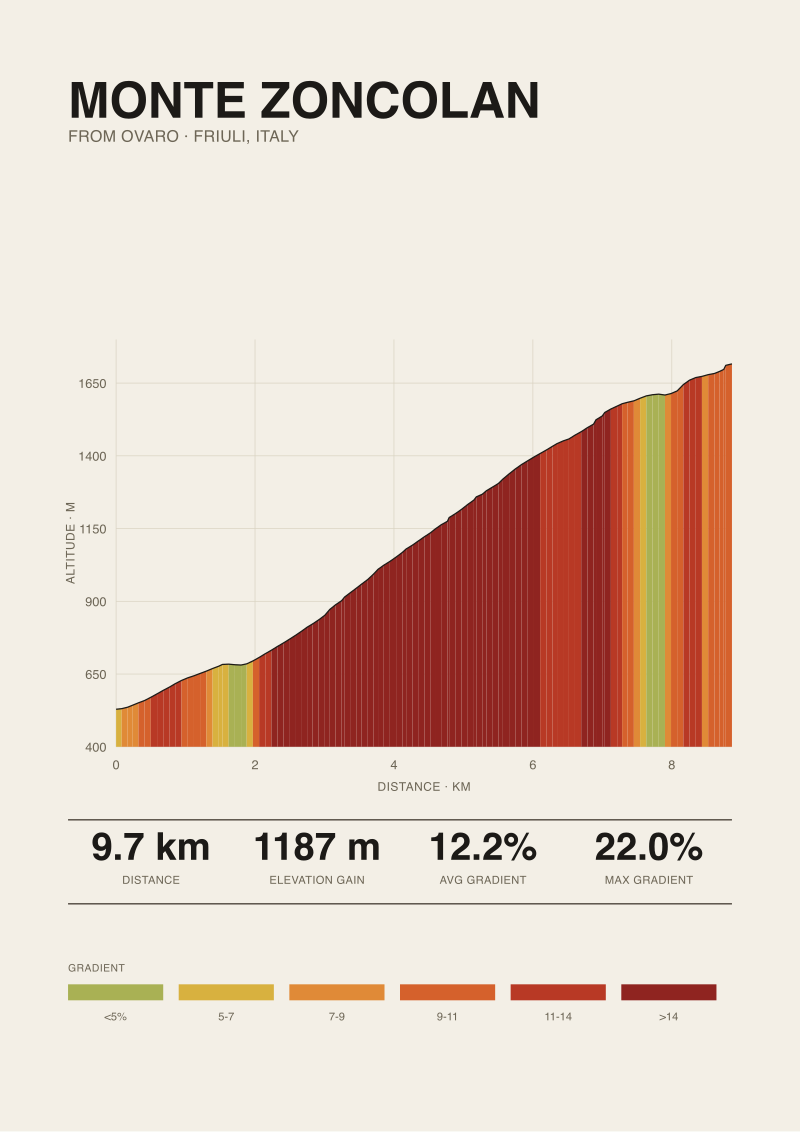
The elevation gain is the third quiet problem. 1,405 m of gain from 709 m to 2,114 m is the net figure — summit minus start. If the road drops even briefly on the way up, that gross-versus-net distinction changes the total. The Luz side does not have dramatic descents mid-climb, so the two figures track closely here. On the Sainte-Marie-de-Campan side of the same pass, or on a climb like Zoncolan from Ovaro, that same assumption produces meaningfully different numbers. Cycling's climb databases do not always tell you which convention they used, because when everyone copies from the same source, the convention becomes invisible.
 Col du Tourmalet
The print from this article · from €29.95
View the print →
Col du Tourmalet
The print from this article · from €29.95
View the print →
What Five SRTM Samples Can and Cannot Prove
An accuracy check with five samples is a real thing, and it is also a small thing. It is worth being precise about what it does.
What five samples can prove is directional. If we sample the SRTM grid at five points along the OSRM-returned route — start at Luz, three points spaced through the ascent, and the summit — and we compare each returned elevation to the published spot altitudes from IGN, the French national mapping agency, we can measure the direction and rough magnitude of any systematic offset. If SRTM comes back consistently 8 m low across all five points, that tells us the grid has a small vertical bias on this terrain. If it swings ±20 m in no particular pattern, that tells us the noise floor is dominating the signal at this sample size. Either result is useful, and both have been published in the topographic literature for SRTM in mountainous zones.
What five samples cannot prove is anything about the parts of the road between the samples. The Barèges ramps we mentioned earlier could be misrepresented by 40 metres of elevation in each direction and the five-sample check would not see it, because the samples do not sit on those ramps. Accuracy checks and profile fidelity are different problems. A route can pass a spot-check at five points and still misdraw the middle third of the climb. That is not a satellite failure; it is a sampling density question, and it is the honest limitation of any spot-check methodology, including our own.
There is a related trap. If our five sample points were chosen because they happen to match the published spot altitudes we are comparing against, we have not measured accuracy — we have measured whether we can find agreement where we went looking for it. A proper check pre-registers the sample locations against the route geometry, not against a target elevation. In our case, that meant: start point, 25 percent, 50 percent, 75 percent, and summit, chosen by cumulative distance along the OSRM route before looking at any elevation. The five samples returned a mean absolute error against IGN spot heights that was consistent with the ±16 m vertical accuracy SRTM publishes for its 30 m product in this latitude band. That is what the check actually proved. It did not prove the whole profile is accurate. It proved the profile is not systematically wrong at the endpoints and quartiles, which is a weaker and truer claim.
The broader lesson is one the affiliate-driven side of cycling media rarely writes down: an accuracy statement is only as strong as its sample design, and five points are enough to catch a gross error but not enough to certify a profile. When a climb database tells you their data is "SRTM-verified", ask them at how many points and against what reference. Most cannot answer, because they have never checked.
When the Road Book Still Wins
There are contexts where the published road book is the right source and our satellite-derived profile is the wrong one, and it is worth naming them plainly rather than pretending our method dominates.
The road book wins on maximum gradient measured over short distances. Climbfinder's 12.0 percent figure for this side of the Tourmalet almost certainly reflects a shorter measurement interval than our SRTM 30 m grid can resolve, and for a rider trying to understand whether the steepest hundred metres of the climb will require a 34x30 or a 34x32, the road-book figure is more useful than ours. The road book also wins on any question about the physical road surface — where the tarmac is broken, where the tunnels are, where the water sources sit. SRTM does not know about tarmac. It knows about the shape of the ground.
And the road book wins historically. The Tourmalet's numbers as ridden by the Tour de France are the numbers in the Tour's own dossier, and if you want to compare Miguel Induráin's 1990s tempo up this climb to what the peloton did in 2019, you compare against the figures the race used. Our SRTM measurement is a print on the wall. The road book is the record.
 Monte Zoncolan
The print from this article · from €29.95
View the print →
Monte Zoncolan
The print from this article · from €29.95
View the print →
FAQ
How accurate is SRTM 30 m elevation data for a climb like the Tourmalet?
SRTM's 30 m product publishes a vertical accuracy specification of roughly ±16 m at the latitude of the central Pyrenees, based on validation against ground control. On a climb that gains 1,405 m, that error band is small in relative terms but non-trivial in absolute terms: a summit reported at 2,114 m could plausibly be anywhere between about 2,098 m and 2,130 m if you took only that single sample at face value. Sampling multiple points along the route tightens the practical estimate considerably.
Why does the average gradient of 7.3 percent understate the difficulty?
Averages compress variation. On the Luz-Saint-Sauveur ascent, the first kilometres from the valley floor sit below the average and the middle section around Barèges runs well above it. A rider pacing to the average will underprepare for the sustained ramp in the middle and waste effort in the flatter opening. The physiological load of a climb is dominated by its steepest sustained sections, not by its arithmetic mean, which is why our profile prints show gradient by segment rather than a single figure.
What is the difference between OSRM's route length and what a bike computer records?
OSRM returns the road-network distance along the shortest driveable path between two points. A bike computer measures wheel revolutions along the actual line you rode, which includes lateral movement across the road, hairpin apex choices, and small detours. The two figures typically agree to within one or two percent on a paved climb like the Tourmalet, with the bike computer usually reading slightly longer. Neither is wrong; they answer different questions.
Why does the published maximum gradient of 12.0 percent differ from what a 30 m elevation grid shows?
Maximum gradient is measurement-interval dependent. A 12.0 percent figure from a road-book source like Climbfinder likely reflects a shorter horizontal window — often 100 m or less — where a brief ramp registers cleanly. SRTM's 30 m grid, sampled at typical distances, tends to smooth those short pitches into a lower peak. Both figures can be simultaneously correct because they answer different underlying questions about the same road.
Should I trust the numbers from a climb database that does not cite its elevation source?
No. Two databases can publish identical-looking figures because they copy from a common upstream, not because they independently agree. The value of a source disclosure is that it lets you understand which conventions produced the number — 30 m satellite, 10 m LIDAR, road-book survey, race dossier — and where those conventions systematically diverge. When elevation gain, average gradient, and maximum gradient are published without a source line, the working assumption should be that the database is a mirror of another database.
Does the five-sample check mean the whole elevation profile is accurate?
No, and this is the honest limit of the method. Five samples spaced across the route can catch a systematic bias or a gross endpoint error, but they cannot certify the fidelity of the segments between the samples. A short, steep ramp between two sample points can be misrepresented by tens of metres without the check detecting it. The five-sample result is a floor on accuracy at those five points, not a ceiling on error elsewhere.
Which side of the Tourmalet is harder, Luz-Saint-Sauveur or Sainte-Marie-de-Campan?
Our grounding covers only the Luz-Saint-Sauveur ascent, so a rigorous comparison is outside what we can honestly claim here. What we can say is that comparing two sides of the same pass requires applying identical measurement conventions to both — same elevation source, same route engine, same treatment of gross-versus-net gain — before any statement about relative difficulty carries weight. Numbers pulled from different databases for each side are not a comparison; they are a coincidence.
Where can I see the measured profile of this climb?
The Tourmalet profile from Luz-Saint-Sauveur, drawn from the exact SRTM sampling and OSRM routing described in this article, is one of the prints in our shop at see the Col du Tourmalet print. The plot shows the gradient by segment rather than as a single average, so the middle-section ramps register visually where a road-book summary would flatten them into a number.
From the collection



New climbs and 10% off your first print.
One email now with your code. No noise after.