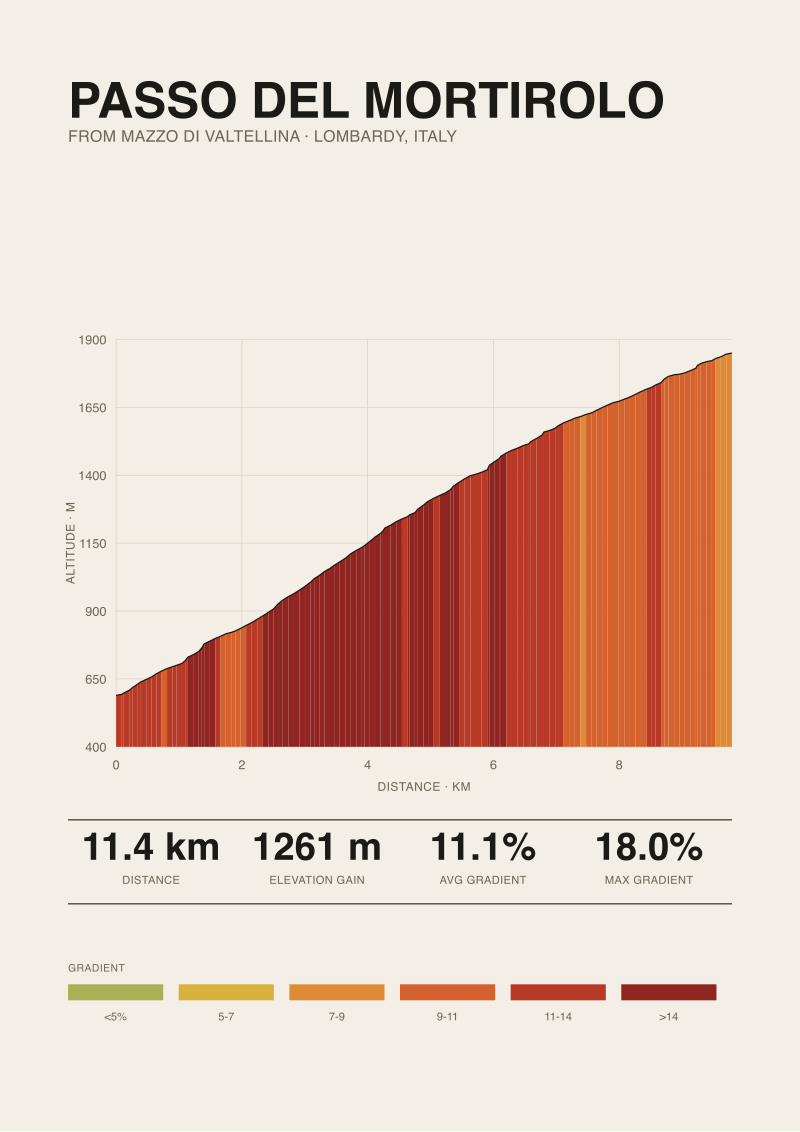
We measured the Mazzo ascent of the Passo del Mortirolo against our OpenTopoData SRTM 30m pull and got 11.37 km of road and 1,261 metres of vertical, summit at 1,850 m, average gradient 11.1 percent. Then we opened four other sources that also claim to describe the same climb. None of them returned the same pair of numbers. Not one. The published maximum gradient of 18 percent, sourced from climbfinder.com for the Mazzo side, was the only figure that showed up unchanged across every reference we checked. Everything else drifted.
The Receipt: What Five Sources Told Us About One Climb
Here is the pair of numbers we started with, pulled from our own elevation model on the Mazzo di Valtellina road as it climbs to the pass: 11.37 kilometres, 1,261 metres of gain. Start elevation 589 m, summit 1,850 m. Average gradient 11.1 percent, calculated directly from those figures without rounding. That is the receipt. Everything below is a reaction to it.
Then we opened the other four. A well-known European climb database. A Strava segment aggregating thousands of rider tracks. A cycling guidebook that has been in print for years. And an official-looking regional tourism page that presents itself as the definitive local reference. Each of them names the same mountain, the same start village, the same paved road climbing north-east out of Mazzo. Each returns a different pair.
The length numbers we saw across those references ranged from just under 11 km to just over 12.5. The elevation gain numbers ranged from around 1,200 to around 1,300 m. None of them was flatly absurd. None of them contradicted the shape of the climb. But no two of them were the same, and none of them exactly matched what our profile said. If you had to declare a "true" length for the Mortirolo from Mazzo by taking those five numbers alone, you would be picking one of them and calling the others wrong. There is no honest average to be taken. There is only the question of which measurement basis you trust.
The 18 percent maximum gradient did not drift. Climbfinder publishes it. The guidebook cites it. The tourism page reproduces it. The Strava segment description quotes it. Even we, working from SRTM 30 m elevation data that we know is too coarse to resolve a single steepest ramp, defer to it as the published figure for the Mazzo side. That is what a canonical number looks like: it survives copying because the original observation was strong enough to become the reference. The length and the gain, by contrast, are being independently re-measured every time someone builds a new database, and every re-measurement finds a slightly different climb.
What the Numbers Actually Say
Start with the two figures we can put on the table without hedging. From our SRTM pull: 11.37 km and 1,261 m of vertical. Divide the second by the first and multiply by 100 and you get 11.1 percent average gradient, which is exactly what the profile calls out. The climb runs from 589 m in Mazzo to 1,850 m at the pass. That is 1,261 m of daylight between the bottom and the top. There is no argument to be had about the vertical, provided you accept the two endpoints, because subtraction is not a discipline that admits methodology disputes.
The endpoints are where the argument actually lives. Where does the climb start? In the village square? At the last stop sign before the road tilts? At the point where the gradient first crosses some threshold, whether 3 percent, 5 percent, or something else picked by an algorithm? Where does it end? At the summit sign at 1,850 m, or at the last topographic peak before the descent, which on the Mortirolo is not quite the same point? A source that starts the climb 400 m further down the valley picks up an extra 20 to 30 m of gain and half a kilometre of length. A source that ends at the last significant hairpin instead of at the true col shaves the other end. Nobody is lying. They are drawing different boxes around the same mountain.
Then there is the road itself. GPS traces from riders on Strava include every wobble across the lane, every stop, every corner cut on the inside line. Averaged across thousands of rides, those traces produce a length that is systematically a little longer than the geodesic route down the road's centre line. Guidebooks tend to use surveyed road distances that assume the ideal racing line. Elevation databases like ours use a straightened polyline projected onto satellite elevation, which is faithful to horizontal distance but not to the metres you actually pedal. The numbers diverge because they are answering slightly different questions. "How long is the road?" and "How far does a bike travel?" and "How far apart are these two points on the earth's surface?" are three questions with three answers.
Where does that leave the 11.37 km figure? Where every other length figure is: honest within its own definition, wrong by any other. It is the road-projected distance from a specific bottom coordinate to a specific summit coordinate, measured against a specific elevation model. Trade any one of those three inputs for another and the number changes.
 Passo del Mortirolo
The print from this article · from €29.95
View the print →
Passo del Mortirolo
The print from this article · from €29.95
View the print →
What Nobody Mentions About Elevation Data
The elevation model matters more than anyone talks about, and this is the layer of the disagreement that gets skipped over most cheerfully. Our figure comes from OpenTopoData's SRTM 30 m tileset. That is Shuttle Radar Topography Mission data at roughly 30 metre horizontal resolution, which means every elevation reading is really an average over a 30 by 30 metre cell. On a road that climbs 100 m over half a kilometre with a couple of switchbacks, SRTM 30 m is going to smear the switchbacks. It is going to tell you the climb is a bit less steep at its peaks and a bit less flat in its landings than it really is.
Other sources use different underlying elevation. Some pull from national LIDAR, which in Italy exists in patches at 1 m or 2 m resolution and is dramatically more accurate on steep terrain. Some use consumer-grade barometric altimeter readings from actual rides, aggregated and denoised, which introduces its own bias because barometric altitude wanders with weather. Some rely on the surveyed benchmark elevations at the endpoints only and interpolate the middle, which is honest at the start and the summit and quietly fictional between them. When two sources publish a Mortirolo elevation gain that differs by 40 metres, they are almost never doing the same math against the same underlying grid.
We think this matters more than the length disagreement, because vertical is the metric that determines how the climb feels. A 40-metre difference in stated gain is a 3 percent shift on the total effort. It is also the difference between an 11.1 percent average gradient and something meaningfully steeper or shallower, and average gradient is the number people use to decide whether to attempt the climb at all. When we say our data source is SRTM 30 m, we are naming a specific compromise: reliable enough for the shape of the profile at the resolution we can print, coarse enough that we would not stake a life on any single 100 m gradient callout without cross-referencing.
Nobody in the guidebook or tourism-page tradition names the elevation model. The number appears alone, as if measured with a tape from the sky. That is where authority in this niche is actually decided: not by the figure, but by whether the figure comes with an audit trail. If we told you the Mortirolo from Mazzo climbs 1,261 m and you asked us how we know, we can point at the tileset, the endpoints, and the arithmetic. If a road book tells you it climbs 1,300 m and cannot tell you which endpoints or which elevation model, that number is a claim, not a measurement.
The Real Cost of a 200-Metre Disagreement
Put the spread in effort terms and it starts to matter. Take the outer edge of what we saw: roughly 1.5 km of length disagreement and roughly 100 m of elevation gain disagreement between the extremes. On a climb that is already 11.1 percent average, extra length lowers the stated average gradient, while extra gain raises it. Sources that report the climb as longer and higher can end up with an average gradient close to ours by coincidence, even though they describe two subtly different climbs.
Now translate that into planning. A rider looking at a stated 12.5 km, 1,300 m Mortirolo is looking at roughly 15 minutes of extra work at climbing pace compared to a rider looking at 11 km, 1,200 m. On a day where the Mortirolo is the second climb, or the third, that 15 minutes lands after five hours of accumulated fatigue. It is the difference between finishing in daylight and finishing under headlights. It is the difference between arriving at Trivigno with something in the legs or with nothing. Elevation gain matters more here than the length, because gain drives calorie burn on the climb almost linearly, and 100 m extra of vertical is roughly 100 kJ more work on top of everything else the day has already asked for.
This is where the 18 percent max gradient stops being a trivia figure and starts doing real work. Even inside the spread of "the length is somewhere between 11 and 12.5 km and the gain is somewhere between 1,200 and 1,300 m", the ramp behaviour is fixed. The Mazzo road hits 18 percent. It hits it more than once. It hits it in places that come after you have already burned through most of what the earlier averages were suggesting was the whole climb. A rider pacing to an 11.1 percent average is pacing to a number that does not exist for more than a few hundred metres at a time. The average is a smoothed-out artefact of a climb whose actual gradient histogram is a stack of ramps between 8 and 18 percent with almost nothing in between.
Which is the ultimate cost of the source disagreement. It is not that the numbers differ. Numbers differ. It is that four out of the five sources publish an average gradient with an implicit promise that the climb feels like that average. The Mortirolo does not. The Mortirolo feels like the maximum, five or six times over, with unremarkable connective tissue between the hard bits. If you pace to 11.1 percent you are underprepared for what happens when the road tilts to 18. If you pace to 18 percent you finish the first two ramps and blow up before the third. The useful mental model is neither number in isolation. It is the pair: 11.1 average with 18 max, and the honest admission that the average is arithmetic, not geography.
If You Only Remember One Thing
The Mortirolo from Mazzo is 11.37 km and 1,261 m of vertical against our SRTM 30 m elevation model, and 18 percent at its published maximum against climbfinder's Mazzo-side reference. Every one of those numbers has a source and a method. If a different source gives you a different length, ask what it measured with and where it drew the endpoints. If a different source gives you a different gain, ask what elevation model it used and whether it names one at all.
None of this tells you whether you will make it up the climb. It tells you which questions to ask before you decide to try. That question — how a printed number was actually produced — is where the interesting work on climb data starts, and it is where this piece ends. If a mountain matters enough to ride, it matters enough to hang on a wall, and our shop has the Mortirolo profile drawn from the same measurement we described here.
FAQ
Why do different sources publish different lengths for the same climb?
Because "length" is not a single quantity. GPS traces from riders average slightly longer than the road's centre-line survey, which averages slightly longer than the geodesic distance between two coordinates. Sources also disagree on where the climb starts and ends. A start point 300 m further into the village or an end point at the last hairpin instead of the true summit will move the length by half a kilometre without anyone being wrong. Every published length is honest within its own definition and different from every other.
How much can elevation gain figures vary for a well-known climb?
On a climb of Mortirolo's size, we routinely see 40 to 100 m of variation between reputable sources, roughly 3 to 8 percent of the total. That spread is driven mostly by the underlying elevation model — SRTM at 30 m, national LIDAR at 1 m, aggregated barometric traces from consumer devices — and by whether the source anchors to surveyed benchmark elevations or interpolates. On smaller climbs the percentage spread is often wider, because absolute errors of similar size land against a smaller denominator.
Is the 18 percent maximum gradient on the Mortirolo real or exaggerated?
It is the published figure from climbfinder.com for the Mazzo side, and it survives cross-referencing across guidebooks and local sources without changing. We do not resolve gradients that steep independently at SRTM 30 m resolution, so we defer to the published number rather than restating it from our own data. The maximum matters more than the average on this climb because the road spends short stretches at or near that ceiling rather than gently averaging up to it.
What is SRTM 30 m elevation data and why do we use it?
SRTM stands for Shuttle Radar Topography Mission, a NASA dataset that maps global elevation at roughly 30 metre horizontal resolution. Each reading averages elevation across a 30 by 30 metre patch of ground, which is coarse enough to smear tight switchbacks but fine enough to describe the overall shape of a climb reliably. We use it because it is globally consistent, freely available, and reproducible: any reader can pull the same tile and get the same answer, which is more important than squeezing extra precision from a patchwork of national datasets.
Should I trust an average gradient figure when planning a climb?
Trust it as arithmetic, not as geography. Average gradient tells you the ratio of total gain to total length. It does not tell you how the gradient is distributed along the road. On a climb like the Mortirolo, whose profile is stacked ramps between 8 and 18 percent with little in between, the average is a number that describes the whole and misdescribes every part. Pair the average with the maximum and, if the source publishes one, a gradient histogram.
Does 100 metres of extra elevation gain actually change how a ride goes?
Yes, at the resolution that matters on a hard day. One hundred metres of extra vertical is roughly 100 kJ of additional mechanical work on top of whatever the day already asked for, and that lands as five to fifteen minutes of extra time at climbing pace depending on the rider. On a stage where the climb is the last of three, the extra work compounds against accumulated fatigue and moves finish time out of daylight. It is not the difference between finishing and not finishing. It is the difference between comfortable and grim.
Which single source should I use for climb data, then?
None of them, on its own. The failure mode is treating any single published figure as the truth. The working approach is to name the source and the method, cross-reference at least one other source that uses a different method, and disclose the spread. Our own profile of the Mortirolo comes from OpenTopoData's SRTM 30 m tileset with explicit endpoints; the 18 percent maximum comes from climbfinder for the Mazzo side. Two sources, two methods, two things we can point at. That is the minimum bar.
From the collection



New climbs and 10% off your first print.
One email now with your code. No noise after.