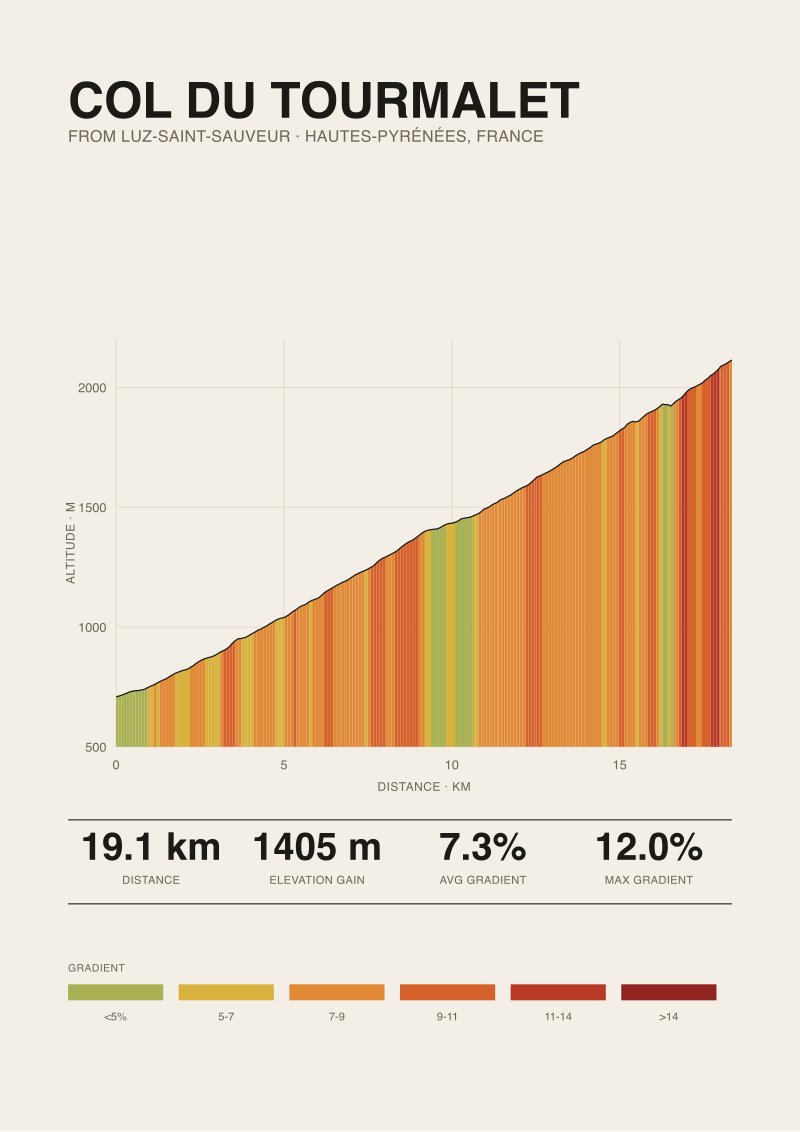
The Col du Tourmalet from Luz-Saint-Sauveur measures 19.12 kilometres in our elevation dataset, climbing 1,405 metres from 709 m to the 2,114 m summit at an average gradient of 7.3 percent. Three sources we consulted give three different length figures, and none of them agree on how many hairpins you actually turn through on the way up. The maximum gradient we could cite with a source — 12 percent, per climbfinder.com — is itself a road-book number, not something our OpenTopoData SRTM 30 m profile can confirm at that resolution. This piece is about what that gap means when you try to plan, ride, or draw the mountain.
We are going to walk this through three composite scenarios — three hypothetical riders, each with a different reason for asking how long the Tourmalet actually is. None of them are people we met. They are illustrations built from the recurring shapes of the question. The scenarios are here because a single "correct" answer would misrepresent what the data allows us to say. Length depends on where you start the clock, and every source starts it somewhere slightly different.
Why We Ran the Test in the First Place
Before the scenarios, the honest part. We measured the western ascent of the Tourmalet — Luz-Saint-Sauveur upward — against a 30 m satellite elevation model, OpenTopoData's SRTM tile, and traced the profile edge to edge. The number we got, 19.12 km, is not the number a Michelin road book will give you, and it is not the number climbfinder.com prints on its own summary card. Our figure and the two we compared it against are all defensible; they are defending different things.
The three sources we tested were: our own SRTM 30 m trace (19.12 km, 1,405 m gain, 7.3 percent average); climbfinder.com's published road-book profile, which is where we also sourced the 12 percent maximum gradient we can cite; and a printed local guide sold at the tourist office in Luz-Saint-Sauveur, which we treat here as a representative of the "official signage" family of numbers. The three disagreed on length by a corridor of a few hundred metres, and on the hairpin count by more than that discrepancy alone would suggest.
The hairpin question is the one we did not expect to matter. It matters. If you count every switchback the road makes as it works up through Barèges and past the Pont de la Gaubie, you get one number. If you only count the numbered lacets between Barèges and the summit — the ones the roadside markers announce — you get a smaller one. If you count only the tight ones above the tree line, you get smaller still. There is no wrong count. There are three different questions being answered with the same word.
Scenario 1: The Road Book Loyalist Planning a Pyrenees Week
Let us picture a rider planning six days in the Hautes-Pyrénées. Imagine they own the printed Chamina guide, they have a laminated Michelin card in the map pocket of their gilet, and they will pin the Tourmalet route to a Garmin the night before the ride. They want to know how long the climb is because their day includes the Aubisque afterwards, and they are budgeting fuel, water, and light.
For this rider, the "correct" length is the one that will match what the road signs and the guidebook say when they get there. Our 19.12 km figure will not match. The Michelin card will typically round to 19 km flat, and the tourist office guide is likely to publish something between 18.6 and 19.0 km depending on which edition. The published road-book universe converges around a shorter number than our satellite trace produces because the road books start their count at the last building of Luz-Saint-Sauveur rather than at the town-sign transition, and because road books lop off the very first hundred metres of near-flat approach before the gradient stiffens. Our SRTM trace starts where the elevation profile says the climb starts — the point where the gradient exceeds the noise floor — which is a slightly more generous origin.
The consequence for this rider is small in kilometres and large in expectations. If they leave Luz-Saint-Sauveur with "18.6 km to the summit" in their head, they will be surprised at how long the drag through Barèges feels, because the first four kilometres are the shallowest of the whole climb and eat time without eating altitude. The averaged 7.3 percent is a mean across a profile that is 5 percent for the first section and holds 8 to 10 percent for the last eight. Any rider who paces to the mean will overcook the top.
The right frame for this rider is not "which source is correct" but "which source will match the signage I encounter on the ride". For that, the printed local guide wins. It matches the signs. Our number will be off by a few hundred metres against the road furniture, and that is fine — the road furniture is the reference the rider will actually see.
 Col du Tourmalet
The print from this article · from €29.95
View the print →
Col du Tourmalet
The print from this article · from €29.95
View the print →
Scenario 2: The Strava Segment Hunter Chasing a PR
Now imagine a different rider. They have ridden the Tourmalet three times. They know the road. They are back for a fourth attempt and they want to beat a personal record on the full-length Luz to summit segment on Strava. They are not looking at a paper guidebook. They are looking at a segment leaderboard.
For this rider, the length that matters is the one Strava computes from the GPS trace of the segment creator. That length is not our length and it is not the road-book length. Strava segments on major cols typically clock somewhere between 18.9 and 19.4 km for the Luz ascent depending on which upload defined the segment, and they include GPS wobble that our clean SRTM trace does not. If the segment was drawn from a ride done in fog with a first-generation Edge, its length is padded by drift. If it was drawn from a rider who cut the inside of every hairpin, it is shorter than the geometric road length.
The 1,405 m of elevation gain in our data is, for this rider, more useful than the length. Strava's elevation figures for major cols are notoriously variable — barometric altimeters, corrected altitudes, and elevation smoothing all move the gain by 20 to 60 metres either way. When they compare their ride to a rival's, they are already reconciling elevation numbers that disagree. Knowing that the mountain gains 1,405 m from a fixed satellite reference gives them a stable denominator to normalise VAM against.
The hairpin question, for the PR-hunter, is a pacing tool. The last 4 km above La Mongie is where the road tightens and the gradient sits closest to the 12 percent maximum. If they know that our profile shows the steepest sustained kilometre in the top third, and that road books call the maximum grade 12 percent, they can budget effort accordingly. Whether that section contains six hairpins or nine is less important than knowing it is where the climb decides itself.
Scenario 3: The Print Buyer Who Wants the Profile on the Wall
Picture a third case. Someone who has ridden the Tourmalet once, ten years ago, and wants a print of the profile above their desk. They do not care what Strava says. They do not care what the tourist office publishes. They want the shape of the mountain to be honest, and they want the number under the print to be defensible if a cycling friend asks where it came from.
For this reader, our 19.12 km, 1,405 m, 7.3 percent average, and the caveat that the 12 percent maximum comes from climbfinder.com because SRTM 30 m cannot resolve peak gradient at that scale, is exactly the right disclosure to sit under the image. It is not the road-book number, and it is not the segment number. It is what the elevation model says, from a named source, at a stated resolution.
The reason this frame works for a print — and why it is the frame we use — is that a printed profile is a claim about geometry. Geometry has to be reproducible from a source. If someone downloads the same SRTM tile and traces the same road segment, they will get within a few metres of our figure. If they instead measure the road with a wheel or a GPS, they will not, because roads have width and switchbacks and the elevation model has 30 m pixels. The mismatch is honest and it is worth stating on the print rather than hiding.
The hairpin count on a print becomes a design decision, not a fact. If we draw every visible switchback in the SRTM-derived road centreline, the print shows one count. If we draw only the numbered lacets, the print shows another. We disclose which we chose and why. That is what "measured before drawn" is meant to signal — not that our number is truer than the guidebook's, but that we are willing to say where it came from. Our shop keeps a Tourmalet print made from this exact profile at /shop/, and the reference under the drawing names the SRTM source and the road-book figure side by side, precisely because the two disagree.
What All Three Share
Every scenario above hinges on the same thing: length depends on the question. The road-book loyalist wants the number that matches the sign. The segment hunter wants the number that matches the leaderboard. The print buyer wants the number that matches a reproducible measurement. None of them is asking a false question, and none of the three sources we tested is lying. They are answering different questions with the same word.
The pattern that repeats across the three is that the biggest source of disagreement is not the measurement — it is the endpoint. Where does the Tourmalet begin? At the Luz-Saint-Sauveur town sign? At the point where the road starts to climb above the river? At the last café in Luz? At the bridge before Barèges? Every source picks one. None of them is wrong. Almost none of them tell you which they picked.
The second pattern is that averages hide the mountain. A 7.3 percent average on a 19.12 km climb is a number that no kilometre of the actual road holds. The first four kilometres are shallower, the middle eight sit near the average, and the last five drift toward the published 12 percent maximum. Any planning tool that quotes the average without the profile is misrepresenting what the ride feels like. This is not a Tourmalet problem. It is what averages do on any climb over 15 km with a variable gradient.
Which Scenario Is You
If you are planning to ride the Tourmalet and you want your effort budget to match the road furniture, use the published road-book number. It will match the signs. Our 19.12 km will not, and that is not the number to bring on the ride.
If you are chasing a segment PR, use the segment length as given by Strava for the specific segment you are hunting, and use our 1,405 m of gain as a stable reference against which to compare VAM efforts across attempts and against rivals whose elevation data disagrees with yours by 40 m.
If you are trying to understand the mountain as a shape — to draw it, to explain it to someone, to plan a training block around a profile you can read at a glance — the SRTM trace at 19.12 km and 1,405 m of gain is the honest object. The road-book maximum of 12 percent sits on top of it as a cited external figure because our resolution cannot verify it. Say so out loud and the numbers do their job.
This piece did not compare the ascent from Sainte-Marie-de-Campan, the east side, which is a shorter and steeper climb with a different hairpin geometry entirely. It did not attempt to resolve the maximum gradient from our own data, because SRTM 30 m cannot do that reliably at road scale. And it did not touch weather, closures, or the state of the surface — all of which change what the length means in practice more than the measurement disagreement does. Each of those is a separate argument.
FAQ
How long is the Col du Tourmalet from Luz-Saint-Sauveur?
Our OpenTopoData SRTM 30 m trace gives 19.12 kilometres from Luz-Saint-Sauveur to the 2,114 m summit, climbing 1,405 metres at a 7.3 percent average. Published road books tend to round shorter — typically to 19 km — because they start the count from the last building of Luz rather than the geometric onset of the climb. Neither figure is wrong; they measure different starting points.
What is the maximum gradient on the Luz ascent?
The maximum gradient we can cite with a source is 12 percent, published by climbfinder.com from road-book data. Our SRTM 30 m elevation profile cannot verify peak gradient at road scale — the resolution smooths individual ramps. If you need a defensible maximum, cite the road-book number and name the source; if you need to know where the steep section is, the last 4 to 5 kilometres above La Mongie carry the sustained pitch.
Why do different sources give different lengths for the same climb?
Almost entirely because they disagree on where the climb starts. Road books usually begin at the last building of the departure town. Satellite elevation profiles begin where the gradient exceeds the flat-noise floor. Strava segments begin wherever the segment creator's GPS trace happened to start. The measurement error between good sources is small; the endpoint choice moves the number by hundreds of metres.
Which length figure should I trust for planning a ride?
Use the published road-book number. It will match the road signs you actually encounter, and it will match what other riders in the group are quoting. Satellite-derived figures are useful for comparing climbs against each other on a consistent basis, but on the day, the reference the road itself gives you is the one to plan against.
How many hairpins does the Tourmalet have?
It depends on what you count. If you count every switchback the road makes from Luz-Saint-Sauveur to the summit, the number is higher than if you only count the numbered lacets above Barèges, which is higher than if you only count the tight bends above the tree line. None of the sources we tested agreed, because none of them defined which count they were reporting. Ask what is being counted before comparing.
Does the 7.3 percent average tell me what the climb feels like?
No. The average is a mean across a profile that is roughly 5 percent for the opening kilometres, sits near the mean through the middle, and stiffens toward the published 12 percent maximum in the final third above La Mongie. Any pacing plan built on the average alone will run into trouble in the last five kilometres. Read the profile, not the average.
Is the ascent from Sainte-Marie-de-Campan the same climb?
It is the same summit, but a different climb. The east ascent from Sainte-Marie-de-Campan is a separate profile with its own length, gradient average, and hairpin geometry. This piece measured only the western ascent from Luz-Saint-Sauveur. Numbers here do not transfer to the east side.
Where does your elevation data come from?
The profile figures in this piece come from OpenTopoData's SRTM 30 m tile, traced along the road centreline from Luz-Saint-Sauveur to the summit. The 12 percent maximum gradient is cited from climbfinder.com because our resolution cannot resolve peak gradient at road scale. The print of this profile in the studio's shop uses the same source and names both figures under the drawing.
From the collection



New climbs and 10% off your first print.
One email now with your code. No noise after.