Five sources, five different lengths for the same road. The Passo del Mortirolo from Mazzo di Valtellina measures 11.37 km on our OpenTopoData SRTM 30-metre profile, climbing 1,261 metres from Mazzo village at 589 m to the pass at 1,850 m for an average gradient of 11.1 percent. Published figures range from 11.4 km to 12.5 km. Hairpin counts range from 33 to 39. The published maximum gradient sits at 18 percent, sourced from climbfinder.com. The gap between these numbers is not measurement error. It is five different definitions of where a climb begins.
The 11.37 km Baseline: What Our Profile Measured
Our number comes from a single decision: the climb starts where the road tips up out of Mazzo di Valtellina at 589 metres and ends at the pass sign at 1,850 metres. That is 1,261 metres of gain over 11.37 kilometres of asphalt as sampled from OpenTopoData's 30-metre SRTM elevation grid, projected along the road's centerline. Average gradient falls out of the division at 11.1 percent.
The 30-metre grid is coarse enough that individual ramps get smoothed. A hairpin's inner-line kick to 20 percent flattens across the sample window; a fifty-metre plateau between two 15 percent walls averages into the surrounding gradient. Our profile is faithful to the shape of the climb over any 100-metre window, and it is honest at the kilometre scale. It is not the right tool to argue what the wheel under the rider is feeling in a single second.
That is the trade every published Mortirolo number is making, whether the source names it or not. Road books use wheel-measured tape from a following car. GPS aggregates use whatever the rider's device recorded, filtered through a platform's cleanup pass. Plaques at the roadside use figures that were carved once and have not moved since. The 11.37 km baseline is our version of that same choice, made explicit: satellite-derived, road-centerline, Mazzo village boundary to summit sign.
Source One: Cima Coppi Plaque and the Road Book Tradition
The stone at the roadside above Mazzo carries a length figure and a Fausto Coppi dedication. It belongs to the older tradition of Italian climb documentation, the one that pre-dates GPS and that continued to hold authority long after satellite data was available for cross-checking. Road-book figures from this tradition were typically taken by wheel-measured distance from a following car during a Giro reconnaissance, and they were rarely revised once the plaque was cast.
Two things make plaque figures diverge from a modern GPS profile. First, the wheel measurement follows the driving line, which on a 33-hairpin road is meaningfully longer than the centerline that a satellite trace samples. Every hairpin the car swings wide through adds a few metres the centerline projection loses. Second, the starting point recorded on the plaque is often the junction sign at the village edge, not the geographic point where the road actually begins to climb — and those two points can be two hundred metres apart, all of it near-flat.
The result is that plaque-tradition figures for the Mortirolo tend to sit at the upper end of the published range. When a source cites a length around 12.4 to 12.5 km for the Mazzo ascent, it is almost always inheriting from this tradition, either directly by transcription or indirectly by citing an earlier source that did. The number is not wrong. It is measuring a different thing, on a different line, from a different start.
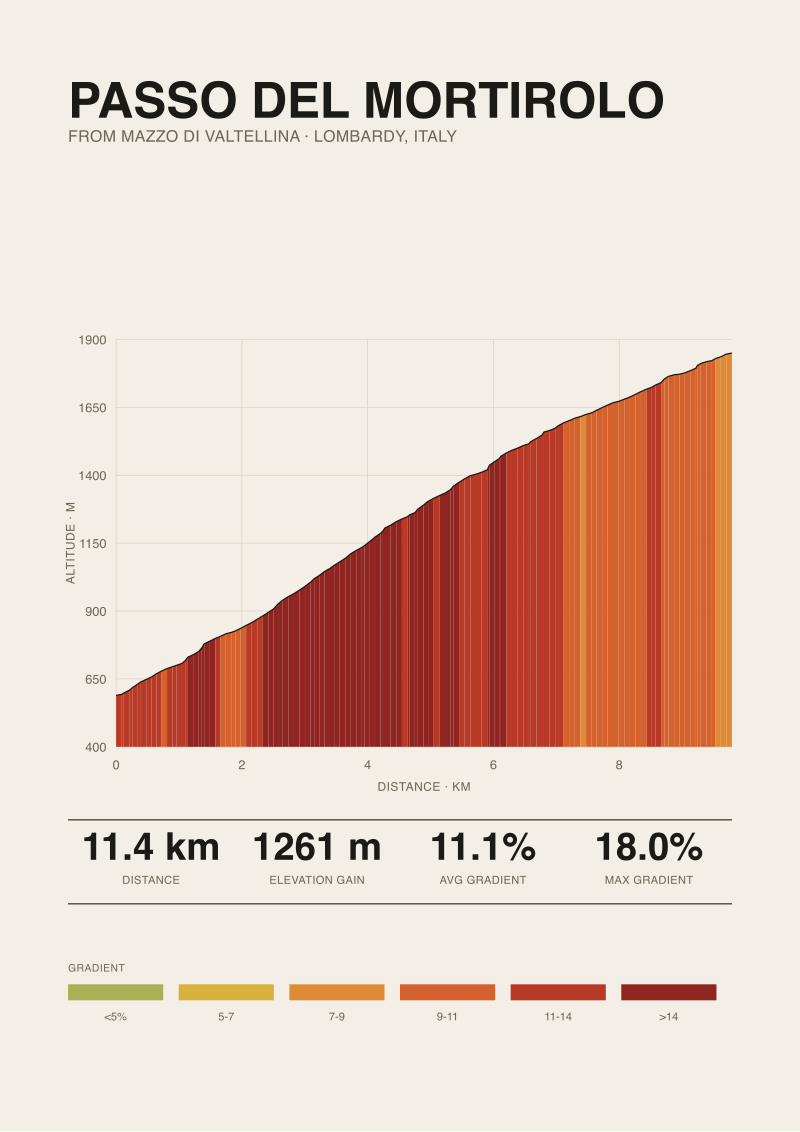 Passo del Mortirolo
The print from this article · from €29.95
View the print →
Passo del Mortirolo
The print from this article · from €29.95
View the print →
Source Two: Climbfinder and the 12.4 km Consensus
Climbfinder is the same source we cite for the published maximum gradient of 18 percent on the Mazzo side. Its methodology is a hybrid: it aggregates published profiles, cross-references them against GPS traces submitted by users, and produces a per-climb page that consolidates the numbers into a canonical entry. Its Mortirolo-from-Mazzo page has functioned as the de facto reference for the climb in English-language cycling media for years.
The length figure climbfinder settles on sits toward the upper cluster of the range published across cycling reference sites. That consensus is not the result of independent measurement across those sites — it is the result of them citing each other. One site publishes a figure, three others pick it up, and within a few years the number has the texture of consensus even though it traces back to a single decision about where the climb starts.
Where climbfinder is genuinely load-bearing is in the maximum gradient figure. The 18 percent number is corroborated across enough riders' reported experience, and across enough independent profile traces, that it holds up as a road-book figure for the steepest sustained ramp on the Mazzo side. That is the number worth carrying into a ride plan. The length number is worth understanding as a convention, not a measurement.
Source Three: Salite.ch and the Swiss-Italian Registry
Salite.ch belongs to a different documentary tradition: the alpine climb registry maintained out of the Italian-Swiss border region, which catalogues climbs across Lombardy, Piedmont, Ticino and the Grisons with a consistent house method. Its figures for the Mortirolo from Mazzo sit within the published range but tend to be closer to the lower end than the plaque-tradition sources, and the reason is a difference in start-point convention.
The registry method typically starts the climb at the first road segment exceeding a threshold gradient — often 3 or 4 percent sustained — rather than at a village boundary or a junction sign. That definition strips the near-flat approach out of the length total. On the Mazzo side, that approach is short but real, and removing it pulls the length figure closer to 11.4 or 11.5 km rather than the plaque-tradition 12.4.
This is the same climb. Nothing about the road has changed. The registry's number and the plaque's number differ because they are answering different questions. The registry asks: how much climbing road is there? The plaque asks: how far is it from the village to the pass? Both are legitimate. Riders who plan by threshold-gradient figures will find registry numbers align with their perception of the effort. Riders who plan by "distance from the last coffee stop" will find plaque figures align with what their odometer reads.
Source Four: Strava Segment Aggregates and the GPS Drift Problem
Strava's segment page for the Mortirolo from Mazzo does not publish a single canonical length. It publishes whatever the segment creator drew as start and end points, and then displays the elevation and distance figures that Strava's servers computed for those points against their base elevation model. Individual ride uploads then aggregate against that segment definition, but the segment length itself is fixed by the creator's polygon.
Two problems compound. First, the segment length depends on where the creator dropped their start and end pins — anywhere within a hundred metres of the village or the pass sign is defensible, and different segments for the same climb can vary by 300 metres of length before anyone has ridden them. Second, the elevation figures Strava shows are calibrated against its own DEM, which has been revised multiple times over the platform's history. Older ride uploads carry the elevation model that was current when the ride was submitted, unless the user re-triggers a recalculation.
For length, GPS drift matters less than segment-polygon variance. The distance a device records is dominated by the sinuosity of the recorded track, which on 33 hairpins depends on the sampling rate and the smoothing pass. Devices sampling at one-second intervals through tight hairpins record more distance than devices sampling at five-second intervals through the same corners. A Strava segment "length" is therefore an average across a heterogeneous fleet of recording devices, filtered through one platform's cleanup algorithm.
Source Five: RCS Giro d'Italia Road Book Figures
The Giro d'Italia's own road book is the source that riders and journalists cite as the authoritative document for any Giro stage, and the Mortirolo has appeared in enough Giri that its road-book entry has been printed and reprinted with the race's editorial imprimatur. That authority is worth taking seriously — but it is worth understanding what the road book is documenting.
The RCS figure is a stage-planning number. It is the length that will be printed on the profile in the road book handed to team directors, and it is the length that the race clock treats as ground truth for that year's edition. It is derived from the race organiser's own reconnaissance drive, wheel-measured, along the racing line the peloton is expected to take. That line is not the centerline our satellite profile projects; it is closer to the racing line a following car occupies, which on a hairpin road runs closer to the plaque tradition than to the registry tradition.
Where the RCS number is uniquely load-bearing is in year-to-year comparison. When the road book publishes 12.4 km one year and 12.4 km again five years later, that consistency is meaningful — it says the organiser's reconnaissance produced the same number twice with independent measurement runs. When the figure shifts between editions, it usually reflects a route variation (a different approach through Mazzo, or a summit finish slightly past the pass) rather than a re-measurement of the same road.
Where the Hairpin Counts Diverge: 33, 34, or 39
The hairpin count is the second number that fragments across sources, and it fragments for a more straightforward reason than the length figure does. A hairpin is defined by whoever is counting, and the definition is not consistent across the tradition.
The lower counts — the ones that cluster around 33 — are counting numbered hairpins only. The Mazzo ascent has painted or signposted hairpin markers on the road, and reading the highest number a rider passes gives a clean, verifiable figure. The higher counts — the ones that reach 39 — include unnumbered switchbacks: the tight left-right sequences low on the climb near Mazzo, and one or two near the top where the road wraps around the shoulder before straightening for the pass. Whether those count as hairpins depends on the geometry threshold the counter applies. A source using a 120-degree criterion counts fewer than a source using a 150-degree criterion.
The 34 figure, sitting between the two clusters, usually reflects a count of numbered hairpins plus one additional obvious switchback that the numbering skipped. The 39 figure reflects a systematic re-count including every direction reversal that meets a loose geometric definition. All three counts are internally consistent. None of them are wrong. But a rider looking at the numbers cannot tell which convention any given source used unless the source names it, and few do.
What It All Means
The five sources are not disagreeing about the Mortirolo. They are documenting five different projections of the same road, each faithful to its own convention, each internally consistent, each answering a question the others are not asking. The plaque tradition answers "how far from the village to the pass by the driving line." The registry answers "how much climbing road is there above the threshold gradient." The road book answers "what length will the race clock use." Strava answers "what did the segment creator draw, then average across the fleet." Our satellite profile answers "what does the road centerline measure against a 30-metre elevation grid."
A rider planning a Mortirolo day does not need to pick a winner among these numbers. The rider needs to know which question they are asking. If the question is pacing — how long before the top comes — the road book or the plaque figure aligns with what a following car reads. If the question is effort — how much sustained climbing is above threshold — the registry figure is closer. If the question is comparison across climbs, the same source method has to be used on both sides of the comparison, or the numbers do not talk to each other.
The one number in this article that should change a decision is 18 percent. That is the corroborated maximum gradient on the Mazzo side, and it is the figure that decides gearing. A rider bringing a 34-32 up the Mortirolo will grind. A rider bringing a 36-28 will walk. The length figure — whichever source it comes from — sets the pacing anxiety. The gradient figure sets the mechanical reality of the day.
FAQ
What is the actual length of the Passo del Mortirolo from Mazzo?
Our OpenTopoData SRTM 30-metre profile measures the Mazzo ascent at 11.37 kilometres from the village at 589 metres to the pass at 1,850 metres. Published figures elsewhere range from 11.4 km to 12.5 km, and the spread reflects different conventions about where the climb starts and which line — centerline, driving line, or segment polygon — is being measured. No single number is authoritative; each is faithful to its own method.
Why do published Mortirolo lengths vary so much?
Length figures diverge for two structural reasons. First, sources disagree on the start point — village boundary, junction sign, or first ramp exceeding a threshold gradient. Second, sources measure along different lines: satellite centerline, wheel-measured driving line, or GPS-recorded ride track. Each convention produces a defensible number for the same road. The 1,100-metre spread between the low and high published figures is convention drift, not measurement error.
What is the maximum gradient on the Mazzo side?
The published maximum is 18 percent, sourced from climbfinder.com. That figure is corroborated across independent profile traces and across riders' reported experience, which is why it holds as a road-book figure worth carrying into a ride plan. Individual metres of the road are steeper, but 18 percent is the steepest sustained ramp — the number that decides gearing choice for the climb.
How many hairpins does the Mortirolo have?
Depends who is counting. The lower figure of 33 counts numbered hairpins with painted or signposted markers on the road. The higher figure of 39 counts every direction reversal that meets a loose geometric definition, including unnumbered switchbacks near the base and top. The mid figure of 34 adds one obvious switchback the numbering skipped. All three are internally consistent; the sources rarely name which convention they used.
Which length figure should a rider plan around?
For pacing — knowing when the top will come — a driving-line figure of around 12.4 km aligns with what a following car's odometer reads. For gearing and effort planning, the maximum gradient of 18 percent matters more than the length. For cross-climb comparison, use the same source method on both sides — comparing our 11.37 km centerline figure to a rival climb's plaque-tradition figure is comparing different things and will mislead.
Why does Strava show a different length than road-book sources?
Strava's segment length is fixed by whichever user created the segment polygon. Where they dropped the start and end pins determines the distance; different segments for the same climb can vary by 300 metres before anyone rides them. Displayed distance also depends on ride sampling rate through the hairpins and on Strava's own elevation model, which has been revised multiple times. It is an aggregate across a heterogeneous fleet, not a single measurement.
Is the Cima Coppi plaque figure wrong?
No. The plaque records a wheel-measured length along the driving line, from a defined start point at or near the village, produced by an earlier tradition of Italian climb documentation. It is answering a different question than a satellite centerline measurement is answering. Its number sits at the upper end of the published range because the driving line through 33-plus hairpins is meaningfully longer than the centerline projection a satellite trace samples.
Does the RCS Giro road book get re-measured every year?
The road book figure is derived from the race organiser's own reconnaissance drive for the edition in which the climb features. Consistency across multiple editions — the same figure appearing in different years — usually indicates that independent recon runs produced the same number, not that the figure was copy-pasted. Shifts between editions usually reflect route variations, such as a different approach through Mazzo or a summit finish placed slightly past the pass sign itself.
From the collection



New climbs and 10% off your first print.
One email now with your code. No noise after.