A cycling gradient is a ratio, not a feeling. Vertical metres gained divided by horizontal metres travelled, multiplied by one hundred. The Passo dello Stelvio from Prato allo Stelvio climbs 1,840 metres over 25.04 kilometres, which resolves to an average of 7.3 percent. That single number is where most conversations about climbs begin and end, and it is also where most riders get the shape of the mountain wrong. The measurement is honest. The interpretation is where things fall apart, and it falls apart in three distinct ways depending on which rider is reading the profile.
Before the scenarios, a note on where our numbers come from. When we draw a climb, we sample the road as a line of GPS coordinates and query elevation for each point from OpenTopoData's SRTM 30-metre dataset — the same satellite radar terrain model that underlies most modern route planners. That gives us a measured profile: start elevation, summit elevation, gain, length, and an average gradient computed from those. Published maximum gradients, on the other hand, come from road books — Stelvio's 14 percent max, Ventoux's 12, Tourmalet's 12, Gavia's 16, all sourced from climbfinder.com and consistent with what regional cycling federations post at the roadside. Measured and published rarely disagree by much on averages. They can disagree sharply on maximums, because a 30-metre grid smooths what a painted sign captures at a single hairpin. That gap matters, and it matters differently for the three riders below.
Scenario 1: The Rider Planning a First Stelvio Attempt
Imagine a rider — call them the planner — booking a week in South Tyrol next July for their first attempt on the Stelvio from Prato. They have never climbed above 2,000 metres. They have ridden 1,000-metre days in the Vosges and one 1,400-metre outing in the Massif Central. They open the profile, see 25.04 kilometres and 1,840 metres of gain at 7.3 percent average, and they run the arithmetic: at 10 km/h that is two and a half hours of climbing. Manageable, on paper.
What the 7.3 percent hides is not the peaks. It is the arithmetic of the whole. The climb starts at 908 metres in Prato and finishes at 2,748 metres at the pass. That is an altitude ceiling most weekend riders have never touched. Above roughly 2,000 metres, aerobic capacity begins to drop measurably. By the top of the Stelvio the planner is climbing in air with about 25 percent less oxygen than they trained in at sea level. The gradient number does not know this. The gradient number is a ratio computed from a horizontal-and-vertical measurement. Altitude is a separate axis of difficulty and it is not encoded in any percentage.
Then there is the 14 percent published maximum. On a 25-kilometre climb averaging 7.3, a 14 percent pitch is a pitch. It is not a wall. It is a stretch of road, possibly a few hundred metres, where the profile bulges. For a rider spinning 34x30 at 70 rpm, 14 percent is uncomfortable but survivable. For the same rider at kilometre 22, above 2,400 metres, with 1,500 metres of gain already in their legs, the same 14 percent bites harder than the same gradient at kilometre 3.
The planner needs to read the profile as a three-part climb. The first ten kilometres to the treeline. The middle section through the hairpins. The final push above 2,400 metres where the air changes. The 7.3 percent average is real, but it is the average of a machine that gets progressively less efficient as it goes. Their pacing plan should not be "hold this power for two and a half hours". It should be "start conservatively enough that the last five kilometres, above 2,400 metres, are still rideable rather than a series of stops".
The measured gradient told them the road. It did not tell them the mountain.
Scenario 2: The Rider Comparing Ventoux and Tourmalet on Paper
Now picture a rider — call them the comparer — trying to choose between a Mont Ventoux week and a Col du Tourmalet week. They have one trip in them this year. They open both profiles side by side.
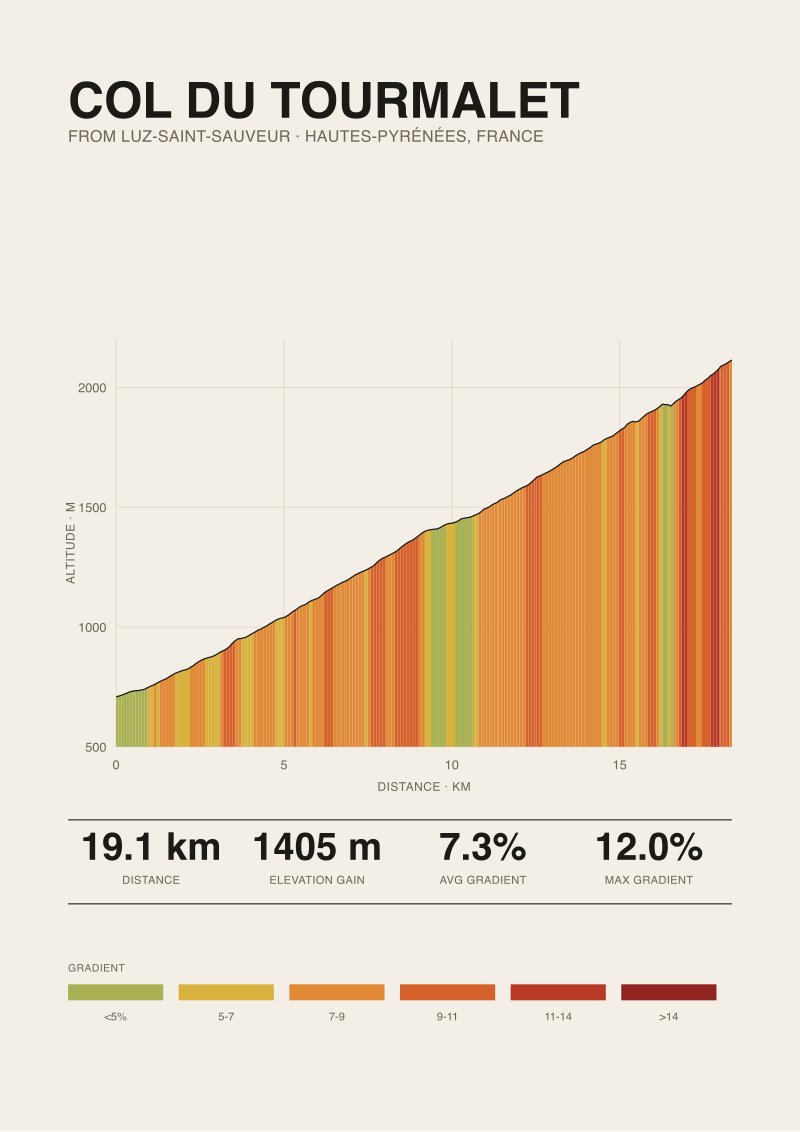
Mont Ventoux from Bédoin: 21.51 kilometres, 1,575 metres of gain, 7.3 percent average, 12 percent published maximum. Col du Tourmalet from Luz-Saint-Sauveur: 19.12 kilometres, 1,405 metres of gain, 7.3 percent average, 12 percent published maximum. On the four headline numbers most riders compare — length, gain, average gradient, maximum gradient — these climbs are functionally interchangeable. Same average. Same max. Ventoux is 2.4 kilometres longer and 170 metres higher in gain. The comparer, reading the numbers, might reasonably conclude Ventoux is a slightly larger version of the same climb.
The measured numbers are correct. The conclusion is wrong.
Ventoux from Bédoin starts at 317 metres and finishes at 1,892 metres. It has a distinct architecture: a shallow opening through the vineyards, then roughly 9 kilometres inside the forest at gradients that stay stubbornly between 9 and 10 percent — well above the 7.3 average — and finally the lunar section above Chalet Reynard where the gradient eases but the wind and the exposure take over. The 7.3 average is a mean of two very different climbs stitched together. The forest section is where the day is decided.
The Tourmalet from Luz-Saint-Sauveur starts at 709 metres and finishes at 2,114 metres. The gradient distribution is more even — the climb steps up gradually, holds a demanding middle, and steepens in its final kilometres near La Mongie. There is no single 9-kilometre block of above-average pitch. The average is closer to the experience.
Same 7.3 percent. Two different climbs. This is the failure mode of comparing averages: the mean tells you the size of the mountain, not the shape of it. Two climbs with identical averages can pace completely differently, because pacing is governed by variance around the mean, not the mean itself. If our comparer is a rider who likes to settle into a rhythm and hold it, the Tourmalet will feel truer to its number. If they are a rider who can absorb a hard middle and recover on easier terrain, Ventoux's structure is more forgiving on the summit than its reputation suggests — the last kilometres, above Chalet Reynard, average less than the forest below.
The published 12 percent max is the same on both. It is also the least useful number for choosing between them. The useful comparison is the distribution — how many kilometres above 8 percent, how many below 6, and where those sit within the climb. That is what the profile drawing is for. It is why we draw them at all.
 Passo dello Stelvio
The print from this article · from €29.95
View the print →
Passo dello Stelvio
The print from this article · from €29.95
View the print →
Scenario 3: The Rider Staring at Gavia's 16 Percent Sign
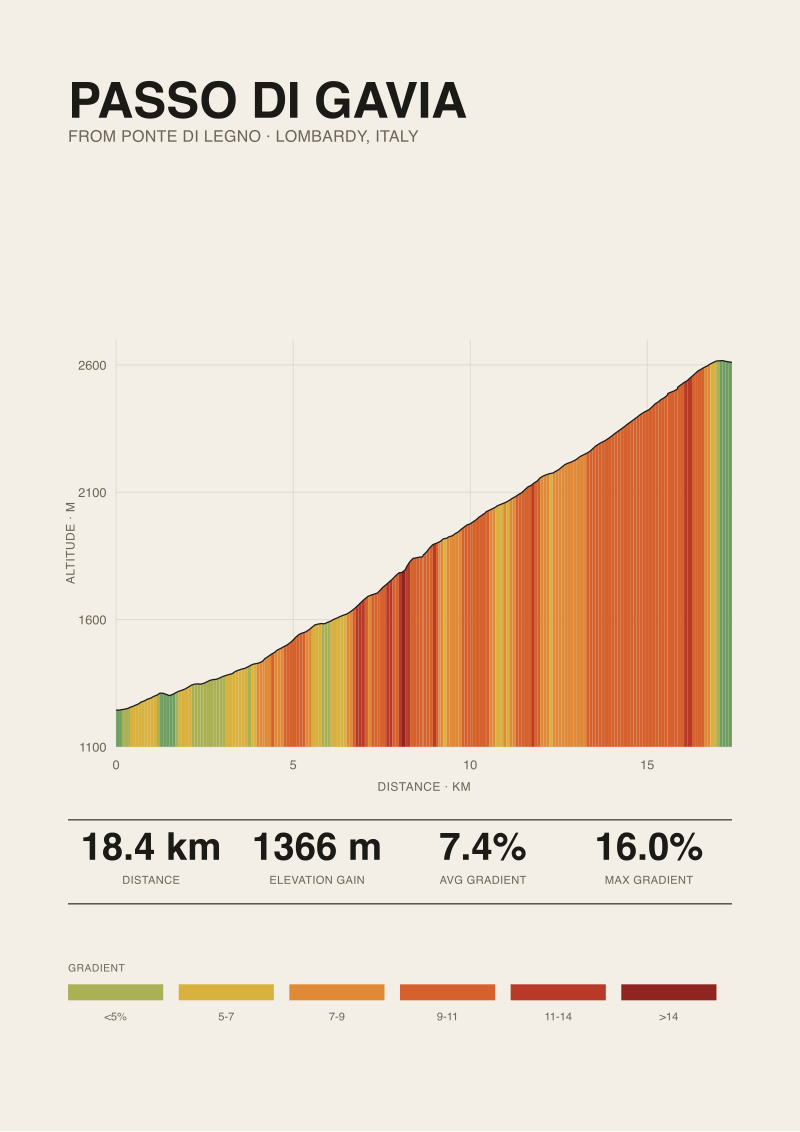
Third rider — call them the sceptic. They have ridden the Passo di Gavia from Ponte di Legno, they have seen the 16 percent sign at the roadside, and now they are back at home looking at our profile, which says the climb is 18.42 kilometres at 7.4 percent average with 1,366 metres of gain. Our data set flags the maximum gradient as 16 percent from climbfinder.com, sourced at Ponte di Legno. They want to know whether the sign was right, whether our profile is right, and how both can be true.
Both are true, and the gap between them is exactly the gap between how we measure and how the road is signed.
Our elevation profile is sampled from OpenTopoData's SRTM 30-metre dataset. That means every point on the road inherits an elevation from a satellite radar grid where each cell is roughly 30 metres square. When we compute a gradient between two adjacent sample points on the road, we are averaging the road's actual pitch across that 30-metre horizontal window. If the real road ramps to 16 percent for 40 metres and then eases to 9 percent for the next 60, the SRTM-derived gradient for that stretch will read somewhere between the two — closer to 11 or 12, not 16. The satellite is not wrong. It is smoothing.
The roadside sign, meanwhile, was placed by someone with a clinometer or a surveyor's measurement over a much shorter baseline — possibly a single 20-metre stretch of the steepest hairpin exit. That reading is also correct. It just measures something different. It measures the worst instant. Our measurement measures the sustained pitch across a 30-metre window.
This is why we report both. The average gradient of 7.4 percent over 18.42 kilometres tells the sceptic what the climb costs in total. The published 16 percent maximum tells them what one particular hairpin feels like under the tyres. Neither replaces the other. Both are honest. The rider who tries to pace by the 7.4 will be surprised at the hairpin. The rider who tries to pace by the 16 will finish the climb having ridden most of it far too conservatively.
The Gavia has a further wrinkle our satellite cannot see. The climb starts at 1,244 metres and tops at 2,610 metres, so most of it is already above the altitude where the atmosphere begins to matter. Combine that with a road that spends long sections above 9 percent — well above the 7.4 average — and the profile becomes one of the least forgiving in Europe despite an average that looks unremarkable next to Stelvio's. The number does not lie. It just does not tell the sceptic what the road does with it.
What All Three Share
Three riders, three misreadings, one common root: the average gradient is the most reported number about a climb and the most inadequate for planning one. It compresses a mountain into a single ratio, and that ratio hides three things at once.
It hides altitude. Stelvio and Ventoux both average 7.3 percent. Stelvio finishes 856 metres higher. That difference lives in a rider's lungs, not in the percentage.
It hides distribution. Ventoux and Tourmalet also both average 7.3 percent. One is front-loaded through a forest at 9 to 10 percent. The other steps up gradually. The mean is identical. The pacing is not.
It hides measurement basis. Gavia's 7.4 percent average and 16 percent published maximum are computed on different scales — one across the whole climb from satellite data, one across a single hairpin from a clinometer. A rider who does not know this reads the two numbers as if they lived on the same axis. They do not.
The fix is not to distrust the numbers. The numbers are all correct within their definitions. The fix is to read a climb as three separate questions. How much work is there in total? That is length and gain. How is the work distributed? That is the shape of the profile — where the above-average pitches sit and how long they last. And how high does the road end? That is the altitude ceiling, which the gradient percentage will never encode. A rider who asks all three questions has a plan. A rider who reads only the headline average has an average.
 Mont Ventoux
The print from this article · from €29.95
View the print →
Mont Ventoux
The print from this article · from €29.95
View the print →
Which Scenario Is You
If you are booking a climb whose summit sits above 2,000 metres and you have not spent meaningful time at altitude, you are the planner. Your risk is not the maximum gradient. It is the last five kilometres. Read the summit elevation before you read the average.
If you are choosing between two climbs with similar headline numbers, you are the comparer. Your risk is treating averages as if they described shape. Look at where the profile bulges above its own mean, and how long those bulges last. The mean tells you the size of the day. The distribution tells you where the day is decided.
If you have ridden a climb, seen a roadside sign that does not match the profile you find at home, and you want to know who is right, you are the sceptic. Both are right. They measure at different resolutions. The published maximum captures the worst instant. The satellite-derived average captures the sustained road. Report them side by side and neither one lies.
If you want the profiles we drew for this piece — Stelvio, Ventoux, Tourmalet, Gavia — measured, gridded, and printed at studio scale, they live at /shop/. They are the same drawings we work from.
FAQ
What is a cycling climb gradient, exactly?
It is a ratio: vertical metres gained divided by horizontal metres travelled, multiplied by one hundred to give a percentage. A road that rises 100 metres over 1,000 horizontal metres is at 10 percent. The number describes the slope of the road, not how hard the climb feels. Feel depends on distance, altitude, gradient distribution, and the rider's fitness — none of which is contained in the ratio itself.
How do you measure the profile of a climb?
We sample the road as a line of GPS coordinates and query elevation for each point from OpenTopoData's SRTM 30-metre dataset — a satellite radar terrain model. From those samples we compute length, elevation gain, start and summit elevations, and the average gradient. It is a repeatable, transparent process. Every number in our climb entries is derived this way and stated alongside the source.
Why does the maximum gradient on a road sign not match the maximum in your data?
Different measurement baselines. A roadside sign is usually taken with a clinometer over a very short stretch of road — sometimes 20 metres at a hairpin exit. Our satellite-derived gradient averages the pitch across a roughly 30-metre horizontal window per sample. A 40-metre ramp at 16 percent gets smoothed toward the pitches on either side of it. Both readings are correct; they measure different things.
Which is more useful for planning: average or maximum gradient?
Neither, on its own. The average tells you the total size of the climb — how much vertical work per kilometre of horizontal effort. The published maximum tells you the worst single moment. Between them sits the number that actually governs pacing: how the gradient is distributed along the climb. Two climbs with identical averages, like Ventoux and Tourmalet at 7.3 percent, can ride completely differently because their distributions differ.
Does altitude affect how a gradient feels?
Yes, and the gradient number does not encode it. Above roughly 2,000 metres, oxygen availability drops enough to reduce sustainable power for most riders. A 9 percent pitch at 2,500 metres on the Stelvio, which tops at 2,748, is a different physiological cost than the same 9 percent at 1,000 metres. When comparing climbs, always read the summit elevation next to the average gradient. Stelvio and Ventoux both average 7.3 percent; only one of them puts you above 2,700 metres.
What does "elevation gain" actually mean on your profiles?
It is the difference between the summit elevation and the starting elevation of the specific ascent we measure — for the Stelvio from Prato allo Stelvio, that is 2,748 minus 908, or 1,840 metres. It is not cumulative gain including small dips and re-climbs, because the classic road ascents we draw are monotonic climbs with minimal descent. When a climb has meaningful false flats or descents mid-route, we say so in the entry.
Why do different sources publish slightly different numbers for the same climb?
Three reasons. First, they may measure from different start points — a village edge versus a specific road junction — which changes length and gain. Second, they may use different elevation datasets: SRTM 30m, SRTM 90m, national LIDAR, or GPS-recorded ride files, each with its own resolution. Third, published road-book figures often round or inherit historical numbers that predate modern satellite data. Our approach is to state the source of every number so the reader can judge which basis they trust.
Do steeper climbs always have higher averages?
No, and this is where the Gavia is instructive. The Passo di Gavia from Ponte di Legno averages 7.4 percent — barely above Stelvio, Ventoux and Tourmalet at 7.3 — but its published maximum is 16 percent, higher than any of the other three. A climb can carry a low average and still contain punishing individual pitches if it also contains easier stretches that pull the mean down. Read the distribution, not just the mean.
From the collection

New climbs and 10% off your first print.
One email now with your code. No noise after.