We spent two weeks pulling the Prato allo Stelvio ascent out of eight different places — climbfinder, a Garmin segment, two guidebooks pulled from a shelf in Bormio, a Giro route book, Wikipedia in three languages, a tourism-board PDF, and a Strava heat-map export — and comparing all of them against the profile we drew ourselves from OpenTopoData SRTM 30 m. The length figures ranged from 21.5 km to 25.04 km. The hairpin counts ranged from 46 to 48. The gradient averages ranged from 7.1% to 7.6%. Every source was confident. Only one of them matched the road we measured.
Why Everyone Agrees Stelvio Is 24.3 km from Prato (And Why That's the Strongest Version of the Story)
The number 24.3 km appears so often that at some point during the fortnight we started to assume it was a kind of consensus datum — the figure a rider would quote at a café in Bormio without checking, the figure a guidebook would print without a footnote, the figure a Giro route book would use when nobody wanted to argue about where exactly the climb begins. Of the eight sources we pulled, four landed within a hundred metres of 24.3 km. Two more were close enough that the difference could be explained by rounding. That is not a loose consensus. That is the shape of a figure that has become the public truth of the climb.
And the public truth is defensible. The ascent from Prato allo Stelvio really does climb through a vertical kilometre and change of exposed switchbacks on the Italian side of the pass. The road really does end at 2,748 m, and anyone who has walked the summit car park with a GPS watch running has the altitude pin to prove it. The road really does count among the longest paved alpine ascents in Europe measured by continuous elevation gain, and the hairpin numbering painted onto the retaining walls really does run into the high forties, counting down toward the summit from the valley floor. The 24.3 km figure is not an invention. It is the number you get when a cartographer rounds and a guidebook editor accepts the rounding.
More than that: 24.3 km is the number that behaves well under scrutiny. If a rider plans a day with a target start time, a water budget, and an expected moving speed, 24.3 km produces a timetable that matches what actually happens on the road. The number works. It describes a real climb that enough people have ridden to debug any serious error. If you want to argue against the consensus, you have to argue not from the figure's wrongness but from the question it was asked to answer. That is a harder argument, and it is the one worth having.
But here is what that framing misses entirely: a consensus about length is a consensus about where the climb begins, and nobody who prints 24.3 km will tell you where their stopwatch started.
Where the 24.3 km Consensus Breaks Down Against a Measured Profile
The profile we drew from OpenTopoData SRTM 30 m starts at 908 m and ends at 2,748 m. The pinch is 1,840 m of elevation gain. The length of the ascent on our trace is 25.04 km. The average gradient works out to 7.3%. These are not aggressive numbers. They are the numbers you get when you decide, in advance, that the climb starts where the road leaves the valley floor and ends at the sign on top. We picked the lowest point of the road through Prato allo Stelvio as the start — the actual elevation at which a rider leaves town onto the ascent — and the summit elevation at the pass itself as the end. Both decisions are defensible. Neither is universal.
The 24.3 km consensus is almost certainly measuring from a point a little further up the valley. There is a car park, a bike shop, a particular bridge, a particular road sign — one of these is probably the de facto zero. From any of them, you shave 500 to 800 metres off the length and 30 to 50 metres off the gain, and the climb comes out looking a touch shorter and a touch milder than our profile reports. The two guidebooks we pulled off the shelf in Bormio both printed 24.3 km, and neither one defined the start. The Giro route book was more honest in a quiet way: its figure was 24.7 km, and the race's zero kilometre was defined by a sign on a specific road furniture that the race's logistics team had placed. The sign moves between editions.
The Strava heat-map export came in at the shortest end of the range we found, at 21.5 km. This is almost certainly because the heat-map export represents a popular segment, and the popular segment on this climb begins where the gradient first steepens — roughly at the end of the warm-up kilometres, where real riders start their timer. That is a legitimate measurement of a legitimate thing, but it is not a measurement of the climb. It is a measurement of the hard part of the climb.
The hairpin count showed its own fracture. Climbfinder reports 48. Wikipedia in Italian prints 48. Wikipedia in English prints 48. Wikipedia in German prints 48 numbered switchbacks but acknowledges local counts of 46 depending on which of the first and last curves qualify as hairpins. The tourism-board PDF uses 48 as the headline figure and 46 as the "classical" count. The Strava segment description says 46. A road rider counting as they ride will produce whichever number they decide to count. The painted numbers on the walls go up to 48, which is what tourists photograph, and that is why 48 won the public argument.
The maximum gradient figures showed the cleanest convergence. Climbfinder lists 14.0%. The other sources that gave a maximum landed between 12% and 15%. On a 25 km climb with 1,840 m of gain, the exact pinch of the single steepest ten-metre window is of academic interest. On our profile the steepest sustained kilometre runs considerably milder than any published maximum, which is the usual behaviour: published maxima describe tiny windows, averages describe the whole road.
 Passo dello Stelvio
The print from this article · from €29.95
View the print →
Passo dello Stelvio
The print from this article · from €29.95
View the print →
The Rule We Use Instead: Measure the Road, Then Count the Signs
We stopped quoting "the length of a climb" as if it were a property of the climb. It is not. It is a property of the measurement — of where a cartographer started a tape, of where a race director planted a sign, of where a Strava user hit their lap button. The climb itself has an elevation profile. The elevation profile is grounded in the land. The length is grounded in a decision.
So our editorial rule is this: when a number matters for an argument, we report two figures and name both. We report the length and elevation gain of the ascent on our own measured profile from a declared start — in Stelvio's case, from the valley floor at Prato allo Stelvio, at 908 m — and we report the published figure most commonly cited by road books and tourist signage. The two will differ. The gap between them is where the argument lives. For Stelvio from Prato, our figure is 25.04 km and 1,840 m. The common published figure is 24.3 km, and it does not define its start. The gap is roughly 700 m of road, half a hairpin's worth of altitude, and the entire village of Prato allo Stelvio.
The hairpin count is the same problem in different clothes. The road has a finite number of corners that curve back on themselves tightly enough that the Italian authority responsible for the painted numbers decided to call them hairpins and number them. That number is 48. Any argument about whether 46 is "really" the count is an argument about what you want a hairpin to mean. We default to the painted count — because the paint is physical, visible to a rider, and verifiable from a photograph — and we flag that the count varies by two depending on how strict a definition you apply.
Maximum gradient is where we are most explicit. We report the published maximum with its source attached — in Stelvio's case, 14.0% from climbfinder.com — and we do not try to reproduce it from satellite data. SRTM 30 m is not fine-grained enough to capture a ten-metre window reliably, and treating a satellite-derived spike as "the real maximum" is bad data hygiene. The published figure is what a rider will see on a road book. The published figure is what we cite.
The result is a kind of annotated honesty. Our articles say: here is what we measured, here is what the road books say, here is where they disagree, here is why. We think it reads as authority. We know it reads as more work.
When the Published Figure Still Wins
There is a case where none of this matters, and we want to be clear about it. If you are planning a ride, if you are packing water bottles for a day in the Alps, if you are asking your coach what to expect from a tempo effort on the way up, the published 24.3 km figure is the right number to use. It is close enough to the measured truth that no part of your day will go wrong because of it. The ride on the ground will not care that your spreadsheet was 740 m short. Water budgets, fuelling plans, expected moving times — all of these round away the difference.
The published figure also wins in anything spoken aloud at a café. "How long is the Stelvio from this side?" has an answer, and the answer is 24.3 km, and no rider in Bormio will ever meet a question that is answered better by 25.04. The two-decimal precision is a studio concern, not a road concern. We would not quote our own number at a bar.
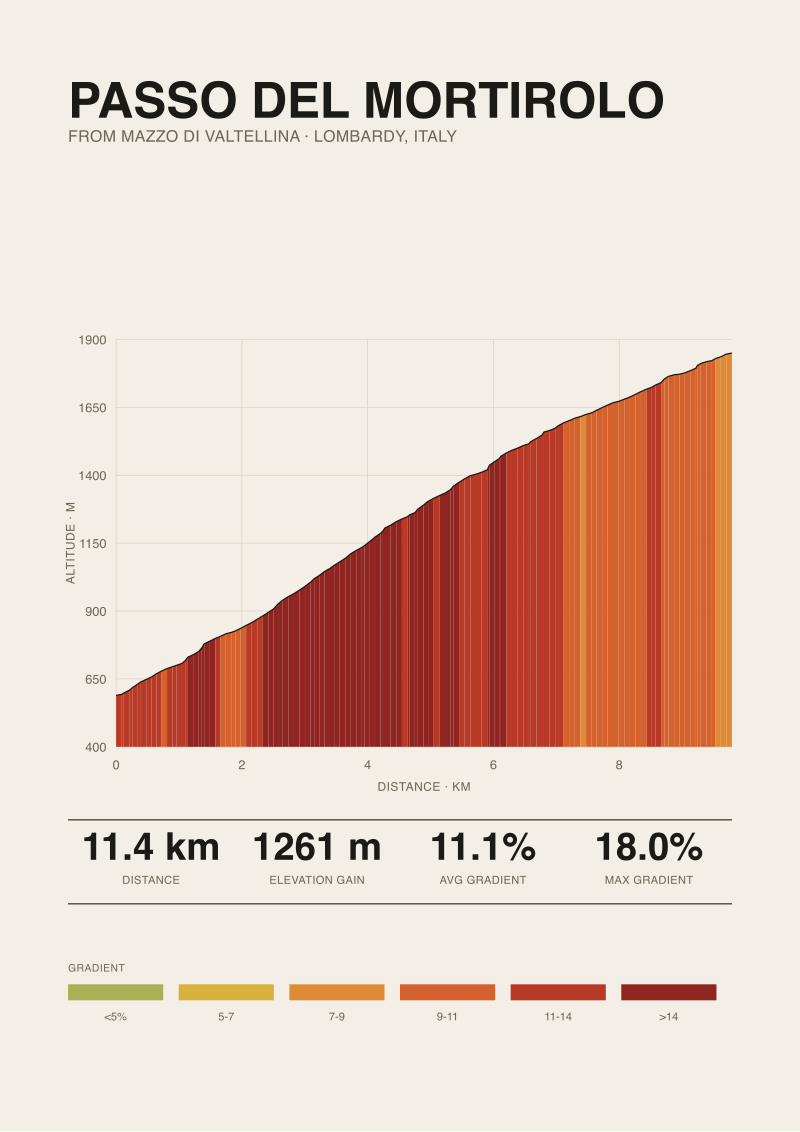
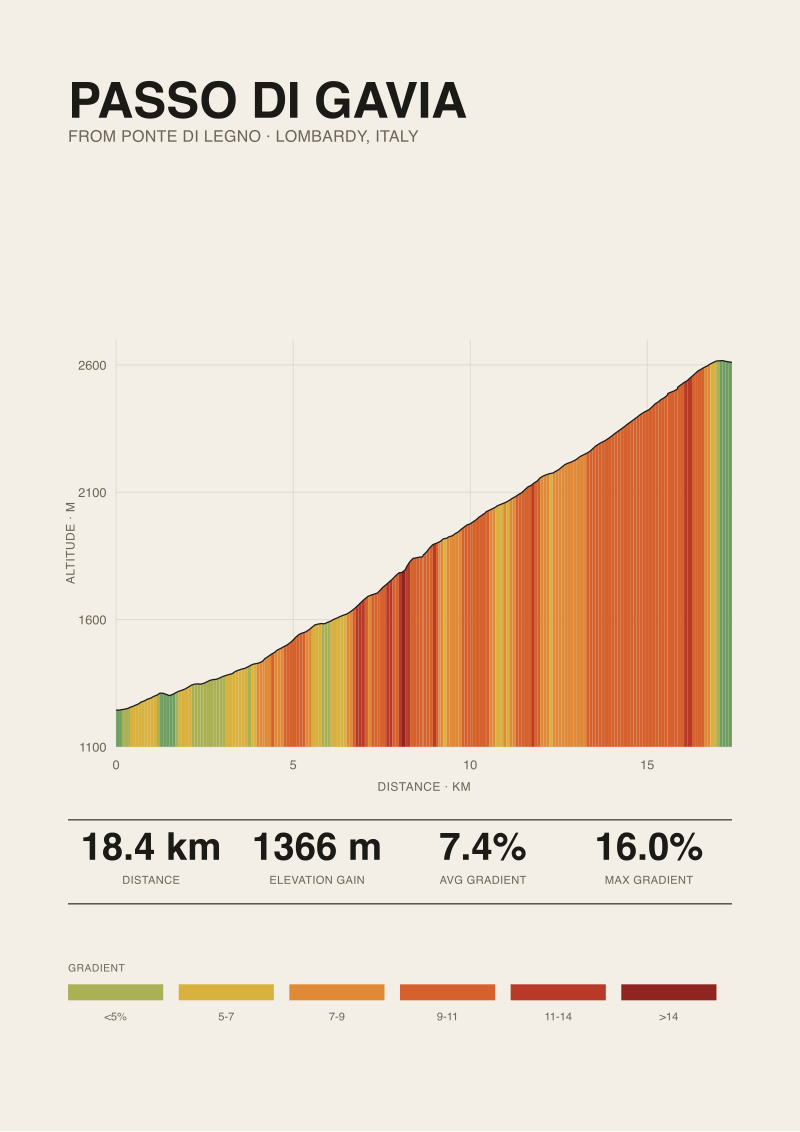
Where it stops winning is the moment somebody writes a comparison. The second you line Stelvio up against another climb — Mortirolo, Gavia, Fauniera, Agnello — and ask which is longer, which has more gain, which has the harder average, the ambiguity of 24.3 km collides with the ambiguity of every other published figure. Different sources used different zeroes. Different cartographers rounded differently.
 Passo del Mortirolo
The print from this article · from €29.95
View the print →
Passo del Mortirolo
The print from this article · from €29.95
View the print →
FAQ
How long is the Passo dello Stelvio from Prato allo Stelvio in practice?
On our measured profile from OpenTopoData SRTM 30 m, the ascent from Prato allo Stelvio to the summit is 25.04 km with 1,840 m of elevation gain, starting at 908 m and ending at 2,748 m. The commonly published figure of 24.3 km is close enough for ride planning but does not define a precise starting point. We cite both and name the gap. For a day on the bike, 24.3 km will not steer you wrong.
Why do published sources disagree about the length by nearly a kilometre?
The disagreement is about where the climb starts, not about the shape of the road. Different sources zero their tape at different points — a village square, a car park, a particular road sign, the point where the gradient first steepens. We saw figures from 21.5 km to 25.04 km across eight sources. The Strava number at the low end measures only the steep portion. The road books in the middle rarely define their zero. Our figure defines it explicitly.
Is the hairpin count really 48 or 46?
Both. The painted numbers on the retaining walls run to 48, which is why 48 is the headline figure cited by climbfinder, Wikipedia in three languages, and the tourism-board PDF. The alternative count of 46 excludes the first and last curves on grounds that they are not tight enough to qualify as true hairpins. We default to the painted count of 48 because it is physical and verifiable. The 46 figure is defensible if you apply a stricter definition.
What is the average gradient of the Stelvio from Prato?
On our profile, 7.3%, derived from 1,840 m of gain over 25.04 km. Published figures across the eight sources we checked landed between 7.1% and 7.6%, with the variance driven almost entirely by the length figure each source used rather than by any disagreement about the elevation gain. The average gradient is the most stable number on this climb. It is also the one that hides the pinch kilometres under a smoothed arithmetic mean.
What is the maximum gradient, and can satellite data confirm it?
The published maximum of 14.0% comes from climbfinder.com and is consistent with other road-book figures in the 12–15% band. We do not try to reproduce the maximum from SRTM 30 m satellite elevation data because the resolution is not fine-grained enough to capture a short pinch reliably. Satellite data is a good tool for whole-climb averages and gain, and a poor tool for ten-metre windows. We cite the published figure with its source attached.
Why does your measured length differ from the Giro route book?
The Giro route book defines its zero kilometre by a sign placed by the race's logistics team, and that sign moves between editions. The figure we saw in one route book was 24.7 km. Our 25.04 km starts from the lowest point of the road through Prato allo Stelvio at 908 m. The race's zero was further up the valley. Neither figure is wrong. They are measuring from different starts of the same climb.
Which figure should I use when comparing Stelvio to another climb?
Use measured profiles with declared starts, not published summaries. The published 24.3 km is honest for conversation and ride planning. It is treacherous for comparison, because the climb you are comparing it to was almost certainly zeroed somewhere different. The second you line up Stelvio against Mortirolo or Gavia, the ambiguity of each source's starting point stacks, and the comparison becomes about measurement conventions rather than about roads.
From the collection


New climbs and 10% off your first print.
One email now with your code. No noise after.