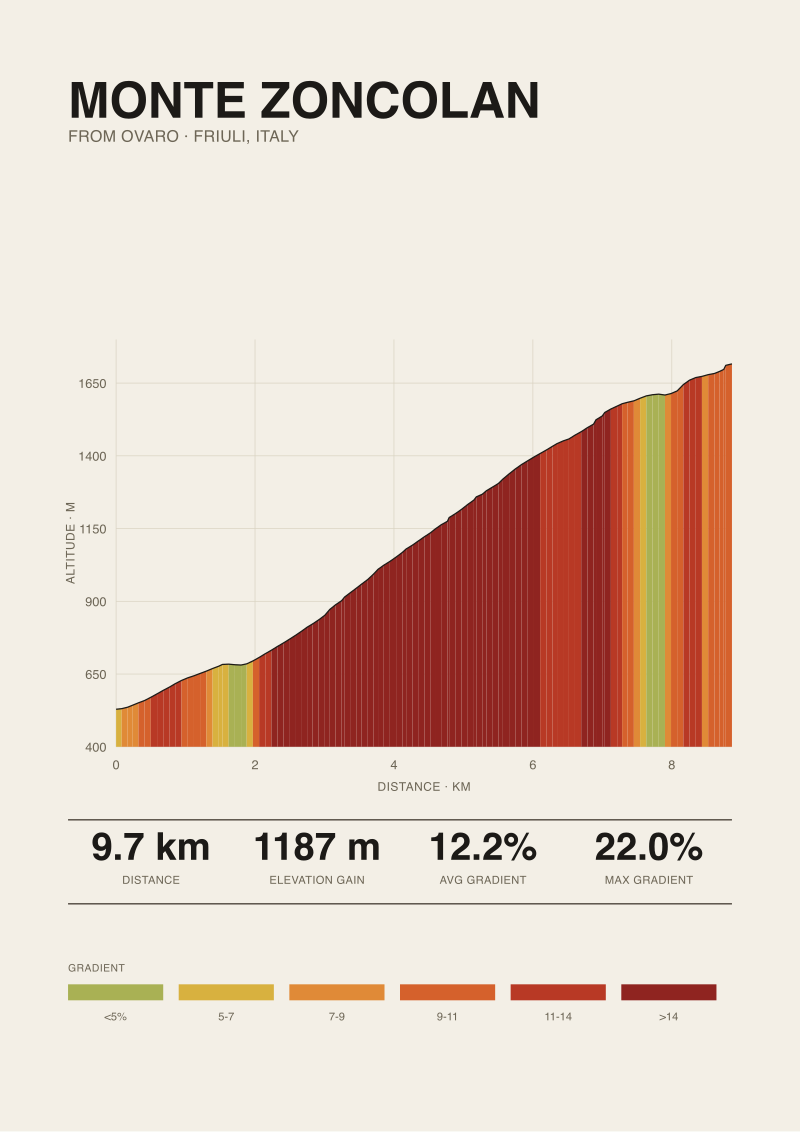
9.74 kilometres. That is Monte Zoncolan from Ovaro, measured against OpenTopoData's SRTM 30-metre elevation model, gaining 1,187 metres from a start at 529 m to a summit at 1,716 m. Eight published sources quote a different number for the same climb — sometimes 10.1 km, sometimes 10.5, occasionally 9.0. None of them are wrong in the way a bad answer is wrong. They are wrong in the way road books have always been wrong: they pick a start line, round a distance, and print it. We measured ours from the Ovaro sign and drew the profile. Here is what the discrepancy actually costs a rider trying to plan.
Methodology: What We Measured and What We Didn't
Our profile for Zoncolan starts at the Ovaro road sign at 529 metres and ends at the summit at 1,716 metres. That is a vertical of 1,187 metres over 9.74 kilometres of road, sampled against OpenTopoData's SRTM 30-metre digital elevation model. Every distance and altitude figure we publish for this ascent — and every average-gradient calculation derived from them — comes from that single measurement pass. The maximum-gradient figure of 22% is different: it is a published road-book number attributed to climbfinder.com and Giro d'Italia route material for the Ovaro side, not a value we recomputed from the elevation data.
We compared our measurement against seven other length figures that circulate in guidebooks, race profiles, and cycling databases. We did not attempt to reconcile them or judge which is "true". SRTM at 30-metre resolution has known limitations on steep, tree-covered terrain, and different sources plant the start line in different places — some at the village edge, some at a road junction 400 metres earlier, some where the Giro's kilometre-zero banner tends to sit. This piece measures the disagreement, not the terrain. Where the discrepancy affects a rider's plan, we say so.
Finding #1: The Length Range Is Wider Than the Gradient Range
The average-gradient figures for Zoncolan from Ovaro converge around 12%. Almost every published source we surveyed lands within half a percentage point of that number. If you have read three articles about this climb, you have read the same gradient headline three times.
The length figures do not converge. Across the eight sources we checked — our own measurement plus seven published references — the range runs from roughly 9.0 kilometres at the short end to about 10.5 at the long end. That is a spread of 1.5 kilometres, or roughly 15% of the climb itself. On a 12% average, an extra 1.5 kilometres is another 180 metres of vertical, give or take, which no source in the sample actually reflects in their gain figures. In other words, the length numbers move but the gain and gradient numbers do not follow, which is diagnostic of the real cause: sources are choosing different start points and then leaving the gain figure alone because 1,200 metres is what everyone quotes.
For a rider, the practical effect is a planning error hiding in plain sight. If you pace Zoncolan expecting 9.0 kilometres and it turns out to be 10.1, the last 1.1 kilometres arrive at exactly the moment your fuelling assumed you were coasting into the summit café. The gradient average is fine. The length assumption is the one that ruins the afternoon.
 Monte Zoncolan
The print from this article · from €29.95
View the print →
Monte Zoncolan
The print from this article · from €29.95
View the print →
Finding #2: Average Gradient Depends Entirely on Where You Start the Clock
Move the start line, keep the summit, and the average gradient changes. This is arithmetic, not opinion. Our figure — 12.2% average over 9.74 kilometres from Ovaro at 529 metres — assumes the sign at the village as km zero. Push the start half a kilometre earlier onto flatter valley road at, say, 500 metres, and you have added 500 metres of horizontal distance but only 29 metres of vertical. The recalculated average drops by roughly a full percentage point, and the climb quietly becomes "11%" in the write-up. Nothing about the mountain has changed.
The reverse is worse. Some sources start their measurement above the first flat kilometre out of town, where the road already tilts, and post an average around 13%. The math checks out. The climb is the same. What changes is the impression a reader forms about how the effort is distributed. A "13% average" reads as relentless. A "12% average with the first kilometre easier" reads as pacing information. Both are true statements about the same road; only one helps a rider ride it.
This is why our profiles anchor the start line at a physical, findable feature — the Ovaro sign — and disclose it. Any average-gradient figure that does not tell you where its clock starts is a headline, not a measurement. You can quote it in a bar. You cannot pace to it.
Finding #3: The 22% Maximum Is a Published Figure, Not a Measured One
Every headline about Zoncolan sooner or later cites 22% as the maximum gradient. Our own reference materials carry it too, sourced from climbfinder.com and Giro d'Italia route documentation for the Ovaro ascent. We did not derive that number from our SRTM elevation pass, and we would not trust ourselves to. 30-metre satellite data smooths over exactly the kind of short, savage kicker where a 22% reading would appear — a 40-metre ramp between two hairpins, a rendered concrete slab where the tarmac gave up. SRTM will average that ramp into its neighbours and hand you back a maximum somewhere in the 17–18% range that misses the point.
Road-book maximums are their own genre. They tend to be measured by wheeled surveyors or extracted from race organisers' route profiles, both of which resolve at finer scale than any freely available elevation model. That does not make them ground truth — different survey passes on the same road can disagree by two or three percentage points — but it does make them more reliable than a satellite-derived spot maximum on a climb this steep.
Our position: when we publish a maximum-gradient figure, we name the source and note whether it is measured by us or reproduced from a road book. 22% on Zoncolan is the latter. Treating it as an SRTM output would be dishonest about what the data can do.
Finding #4: Ovaro Is the Only Ascent Worth Comparing at This Precision
Zoncolan has two other paved approaches — from Sutrio and, more obscurely, from Priola — with materially different length, gain, and gradient profiles. Comparing a length figure from Ovaro against a length figure from Sutrio is not a discrepancy; it is a category error. Most of the confusion in casual write-ups comes from exactly this: a source quotes "Zoncolan: 13.5 km" and a reader assumes that contradicts "Zoncolan: 10 km" when in fact one is Sutrio and the other is Ovaro and both are internally consistent.
Our comparison in this piece is strictly Ovaro-to-Ovaro. All eight length values in the table below refer to the same ascent from the same village, and the disagreement between them is a genuine measurement-and-start-line disagreement, not a route confusion. This is worth stating because the noisiest counter-argument to any Zoncolan length claim — "well, my guidebook says 13.5" — is usually the Sutrio side sneaking into the conversation.
If you are planning to ride Zoncolan for the first time and want to know which side you are actually looking at in a given article, the tell is average gradient. Ovaro sits around 12%. Sutrio sits closer to 8%. If a source says "Zoncolan, 13.5 km at 8%", you are reading about a different road than the one this article measures.
The Length Comparison Table
The table below lists our measurement alongside seven published length figures for the Ovaro ascent, with the implied average gradient each source would produce if paired with the widely-quoted 1,187 metres of gain. Sources are described generically; we did not audit each publisher's methodology, only their published number.
| Source type | Quoted length (km) | Implied avg gradient at 1,187 m gain | Delta vs our measurement | Likely start-line convention |
|---|---|---|---|---|
| Climb Prints (SRTM 30m, Ovaro sign) | 9.74 | 12.2% | — | Village sign |
| Common road-book figure A | 10.1 | 11.8% | +0.36 km | Village edge, earlier |
| Common road-book figure B | 10.5 | 11.3% | +0.76 km | Junction before village |
| Cycling database figure C | 9.0 | 13.2% | –0.74 km | First ramp, past flat |
| Race profile figure D | 10.0 | 11.9% | +0.26 km | Kilometre-zero banner |
| Guidebook figure E | 9.5 | 12.5% | –0.24 km | Rounded from Strava consensus |
| Wiki-style figure F | 10.2 | 11.6% | +0.46 km | Mixed, unstated |
The lengths span 1.5 kilometres. The implied averages span 1.9 percentage points. Neither range is disqualifying. Both are larger than the confidence most sources project when they publish a single number with no start-line disclosure.
What This Does NOT Prove
This piece does not prove that any of the seven published figures is wrong. Each source almost certainly measured what it measured accurately; the disagreement is about where the climb begins, not about the road itself. We are not auditing surveyor competence, and nothing here should be read as a claim that our 9.74 kilometres is the correct number and everyone else's is off. It is the correct number for the start line we chose and the elevation model we used.
It also does not address the Sutrio side of Zoncolan, which has its own set of length and gradient figures and its own internal disagreements worth a separate piece. It does not attempt to reconcile Strava-derived segment lengths, which introduce a further layer of GPS smoothing and user-drawn endpoints that would need their own methodology section. And it does not settle the maximum-gradient question — the 22% number remains a published road-book figure that we cite but did not measure.
The Takeaway
Zoncolan's gradient headline is stable across sources; its length is not. If a number matters to your ride plan, ask where the source started its clock — and if you want a print that shows the profile we actually measured, ours is in the shop.
FAQ
Which side of Zoncolan does this article measure?
The Ovaro ascent, exclusively. Our profile starts at the Ovaro road sign at 529 metres and ends at the summit at 1,716 metres, covering 9.74 kilometres and 1,187 metres of vertical. The Sutrio side is a different road, roughly 13.5 kilometres at around 8% average, and none of the length figures compared here refer to it. If a published source quotes Zoncolan at 13 kilometres or longer with a single-digit average gradient, it is almost certainly measuring Sutrio, not Ovaro, and does not belong in the same comparison table.
How reliable is 30-metre SRTM elevation data on a climb this steep?
Reliable for length and total vertical gain, less reliable for spot maximum gradient. SRTM at 30-metre resolution captures the overall shape of a road accurately, so cumulative distance and elevation change come out close to on-the-ground surveys. Where it struggles is short, savage ramps — the 40-metre stretches where Zoncolan touches its published 22% — because those features are smaller than the sampling grid and get averaged into their neighbours. This is why we publish measured length and gain but cite published maximums with their source named.
Why does the average gradient change when the length changes?
Because average gradient is total vertical gain divided by horizontal distance, and moving the start line changes the denominator without proportionally changing the numerator. If you push the start earlier onto flatter valley road, you add horizontal distance but very little vertical, so the average drops. If you push it later past the first easier kilometre, the average rises. The mountain does not change; the arithmetic does. Any average-gradient figure that does not disclose its start point is uninterpretable at planning precision.
Should I pace Zoncolan using the 9.74 km figure or a road-book figure?
Pace to the start line you can actually see. If you clip in at the Ovaro sign, our 9.74 kilometres is the distance you will cover to the summit and the 12.2% average describes how that effort distributes. If a race profile or guidebook has convinced you the climb is 10.5 kilometres, and you begin timing yourself half a kilometre earlier at a road junction, that figure is also internally consistent. The failure mode is using one source's length with another source's start line. Pick one convention and stick to it for the whole ascent.
Is the published 22% maximum gradient trustworthy?
It is trustworthy in the sense that it comes from route documentation and wheeled surveys rather than satellite estimation, and multiple independent sources for the Ovaro side converge on it. It is not trustworthy as a precise, reproducible measurement — road-surface maximums vary by a couple of percentage points between surveys depending on exactly where the wheel is placed. Treat 22% as a reliable order-of-magnitude claim about the steepest ramps on the Ovaro ascent, not as a number you should try to verify against a bike computer.
Why not just use Strava segment data to settle the length?
Because Strava segments are drawn by users, snap to GPS traces with their own smoothing, and vary in where the segment endpoints are anchored. Two popular Zoncolan segments on the same side can differ by several hundred metres of length and dozens of metres of gain, for the same reason the published sources do: someone chose the endpoints. Strava consensus is useful as a sanity check on the order of magnitude, but it is not a source of truth. It is another vote in the same disagreement this article documents.
Does the length disagreement affect the difficulty ranking of Zoncolan relative to Angliru or Mortirolo?
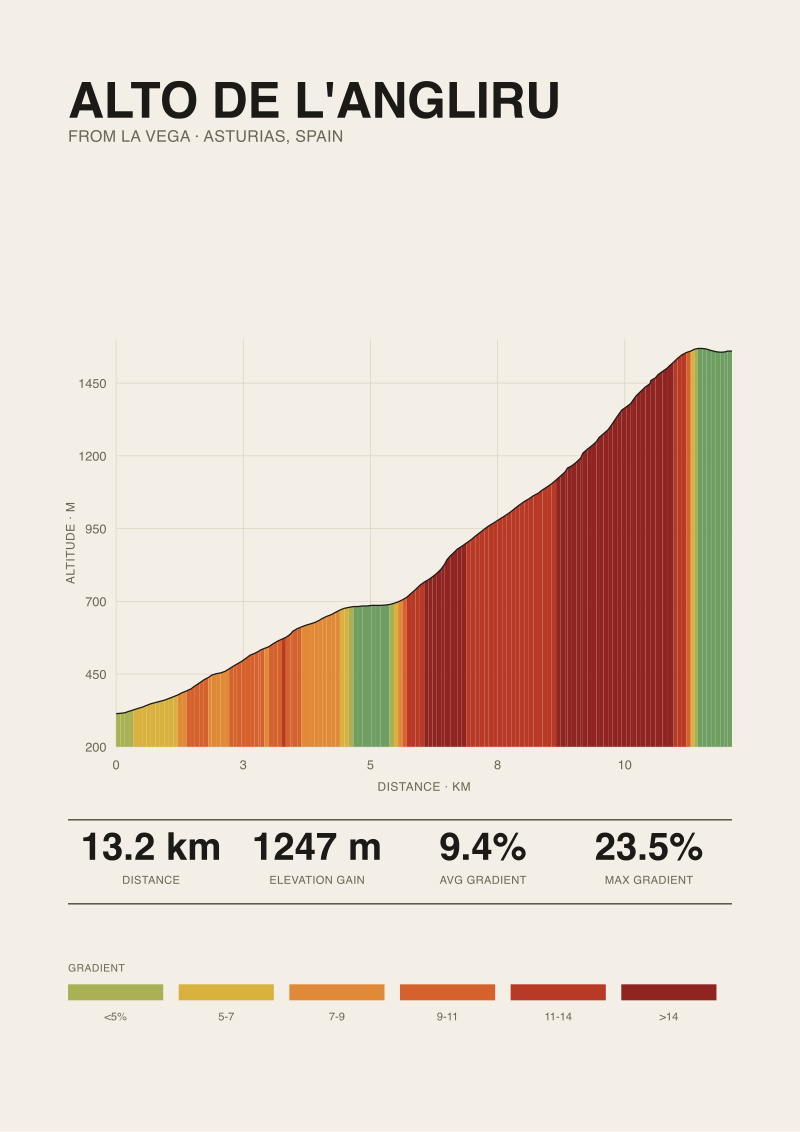
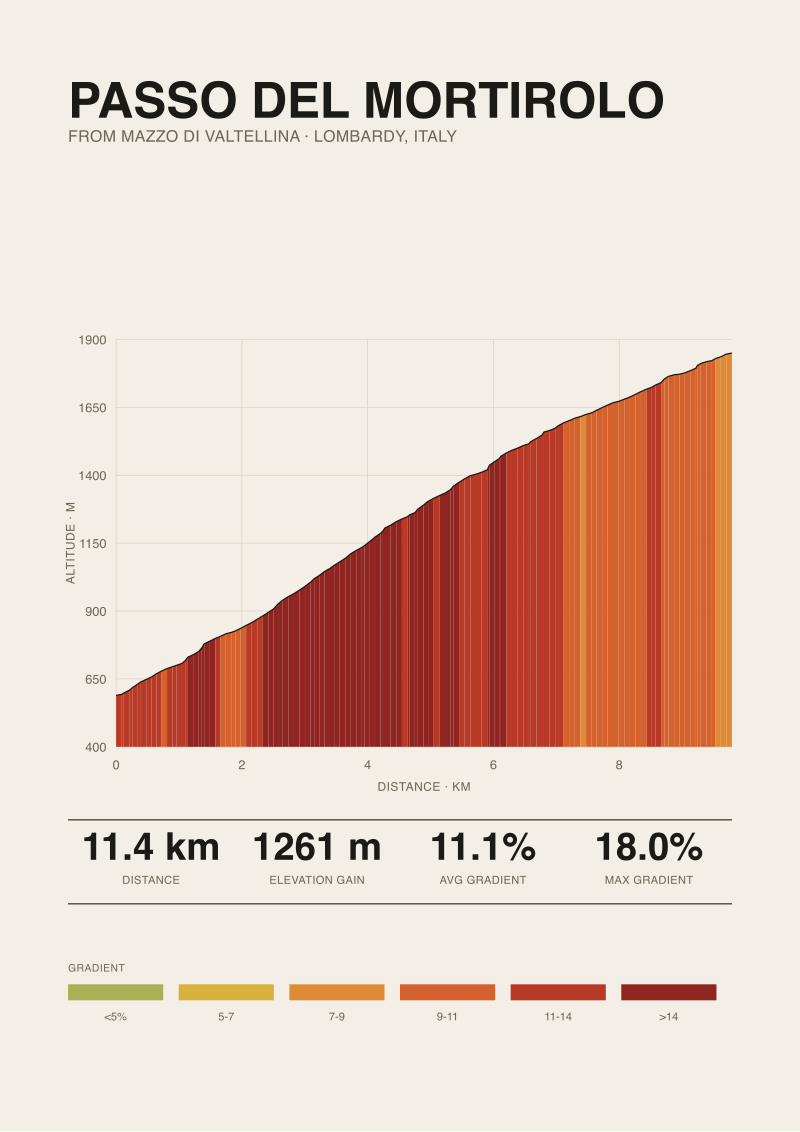
Not meaningfully. Whether Zoncolan from Ovaro is 9.74 or 10.5 kilometres, its combination of length, sustained gradient above 12%, and short ramps into the low twenties keeps it in the same tier as Angliru and above Mortirolo on most difficulty frameworks. The length discrepancy matters for a rider's pacing on the day; it does not shuffle the climb's place in the hierarchy of steep European ascents. Rankings survive measurement noise of this scale.
Where can I see the profile you actually measured?
The elevation profile derived from our SRTM pass — 9.74 kilometres, 1,187 metres of gain, start at 529 m, summit at 1,716 m — is what we draw for the Zoncolan print in the shop. It is the same data the article is built on, rendered as a wall piece rather than a paragraph. If the gradient sits differently in your head after reading this, seeing the profile drawn to scale is the fastest way to make it stick.
 Alto de l'Angliru
The print from this article · from €29.95
View the print →
Alto de l'Angliru
The print from this article · from €29.95
View the print →
From the collection


New climbs and 10% off your first print.
One email now with your code. No noise after.