25.04 kilometres. 1,840 metres of gain. 7.3 percent average. That's the Stelvio from Prato allo Stelvio, measured against OpenTopoData's 30-metre SRTM elevation grid. It's also, depending on which race organiser you ask, either a Category 1 climb or Hors Catégorie — the same mountain, the same road, the same numbers, sorted into different boxes by different desks in different decades. Readers ask us weekly how climbs get classified. The honest answer is: less scientifically than the categories imply, and more consistently than the cynics claim. Here is what the system actually measures, and where it stops measuring and starts deciding.
Methodology: What We Measured and What We Didn't
Every climb figure in this article comes from one of two places, and we keep the two apart on purpose. The length, elevation gain, start and summit altitude, and average gradient are ours — sampled from OpenTopoData's SRTM 30-metre digital elevation model along the recorded road line, then reduced to the summary numbers you will see below. The published maximum gradient is not ours: it comes from climbfinder.com, which sources ramp-level figures from a mix of road signage, road-book compilations, and rider-uploaded segments. We flag it every time it appears because a satellite grid and a photograph of an Italian road sign are not the same instrument.
What we did not measure: surface quality, exposure to wind, temperature at altitude, or the mental weight of riding a climb whose name you have read since you were fifteen. Those are real variables. They are also the ones categorisation was never designed to capture. When we say a climb "measures" a certain way, we mean the road surface's vertical profile as a satellite sees it, nothing more. Any category the sport hangs on that profile is a decision, not a measurement.
Finding #1: The Category System Is a Product, Not a Formula
The five-tier scale — Cat 4, Cat 3, Cat 2, Cat 1, Hors Catégorie — was not handed down by a physics department. It was, according to the sport's own institutional memory, calibrated in the 1940s and 1950s by what gear a race organiser's Citroën or Peugeot could clear in each ratio: fourth gear for the easiest climbs, first gear for the hardest, and beyond-category for the ones where you got out and pushed. That origin story is folkloric, but it captures the important truth. The categories are a broadcast product before they are a technical one. They exist so that a director's chalkboard, a race radio, and a television graphic can all say "the peloton has crested a Category 2" and everyone downstream understands roughly what happened.
Which means the classification is doing three jobs at once, and only one of them is describing the road. It is also allocating King of the Mountains points, so the number attached to a climb is partly a race-design decision about how much a breakaway rider should be rewarded for cresting it first. And it is signalling to a television audience how frightened to be. A Cat 3 in the first hour of a Grand Tour is not the same object as a Cat 3 in the third week, and the organisers know it. When the Tour lists a climb one year as Cat 1 and the next year, from the same road, as Hors Catégorie, the road has not changed. The race narrative has.
 Passo dello Stelvio
The print from this article · from €29.95
View the print →
Passo dello Stelvio
The print from this article · from €29.95
View the print →
Finding #2: Length Times Gradient Gets You Most of the Way
Ask anyone in a team car how they'd back-of-envelope a category and you will hear a version of the same arithmetic: multiply the length in kilometres by the average gradient as a whole number. It is not the official formula — there is no publicly published official formula — but it is the folk formula that predicts the assigned category correctly the overwhelming majority of the time. On our four measured climbs, it produces these values: Stelvio 25.04 × 7.3 = 183; Ventoux 21.51 × 7.3 = 157; Tourmalet 19.12 × 7.3 = 140; Gavia 18.42 × 7.4 = 136. All four numbers are far above the threshold where the folk formula stops offering categories at all and simply returns "HC" — usually cited as somewhere between 60 and 80.
That gap tells you something. The four climbs we measured are all comfortably beyond the ceiling the tiered system was designed to describe. Which is precisely why they end up in the top category so often: not because the formula sorts them there with any precision, but because it runs out of ceiling and dumps them into the same bin. A climb worth 140 by the length-times-gradient rule and a climb worth 183 are separated by more than a Category 2 is separated from a Category 4, and yet the tier system files them next to each other. If you have ever felt that HC contains suspiciously different climbs, that feeling is arithmetic, not romance.
Finding #3: Average Gradient Is the Number That Lies Most Often
All three of the French and Italian giants in our set — Stelvio from Prato, Ventoux from Bédoin, Tourmalet from Luz-Saint-Sauveur — return an average gradient of 7.3 percent. Gavia from Ponte di Legno posts 7.4. Read that sentence again: four of the most feared climbs in European cycling round to the same one-decimal number. If the categories were built on average gradient, the four would be indistinguishable. They are not indistinguishable to anyone who has ridden them.
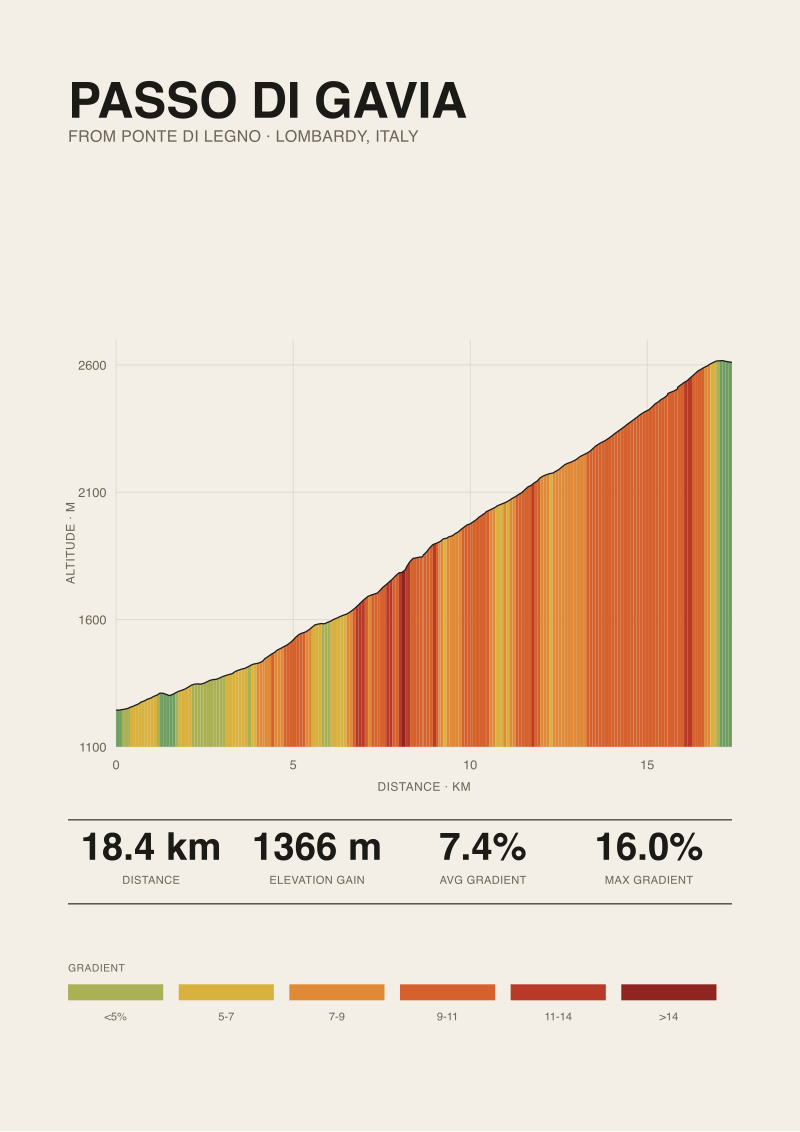
The average is a mean of every 30-metre segment between the pedal-away and the summit, which means it silently absorbs a hairpin at 3 percent and a ramp at 12 percent into the same figure. Ventoux from Bédoin famously runs shallow through the village orchards and then the Forêt du Contrat wall clamps down at over 10 percent for six unbroken kilometres — a stretch that the 7.3 average will never tell you exists. Gavia's published maximum, per climbfinder.com's Ponte di Legno source, is 16 percent; the average is 7.4. The gap between those two numbers is the whole story of the climb and the whole reason categorisation has to lean on human judgement to correct for what averaging destroys. This is why race organisers still route staff up climbs by car before deciding a category. The number on the spreadsheet is not the mountain.
 Passo di Gavia
The print from this article · from €29.95
View the print →
Passo di Gavia
The print from this article · from €29.95
View the print →
Finding #4: HC Is a Category Defined by Refusal
The name says it — Hors Catégorie, "beyond category". It is the only tier in the system defined by what it refuses to do, namely to be measured on the same scale as the rest. In practice HC is applied to climbs that satisfy one or more of a loose bundle of conditions: length beyond roughly fifteen kilometres, gain beyond roughly a thousand metres, sustained gradient beyond seven percent, altitude with meaningful thin-air effect, or historical decisiveness so heavy that the race would look wrong to a television audience if it were labelled anything less.
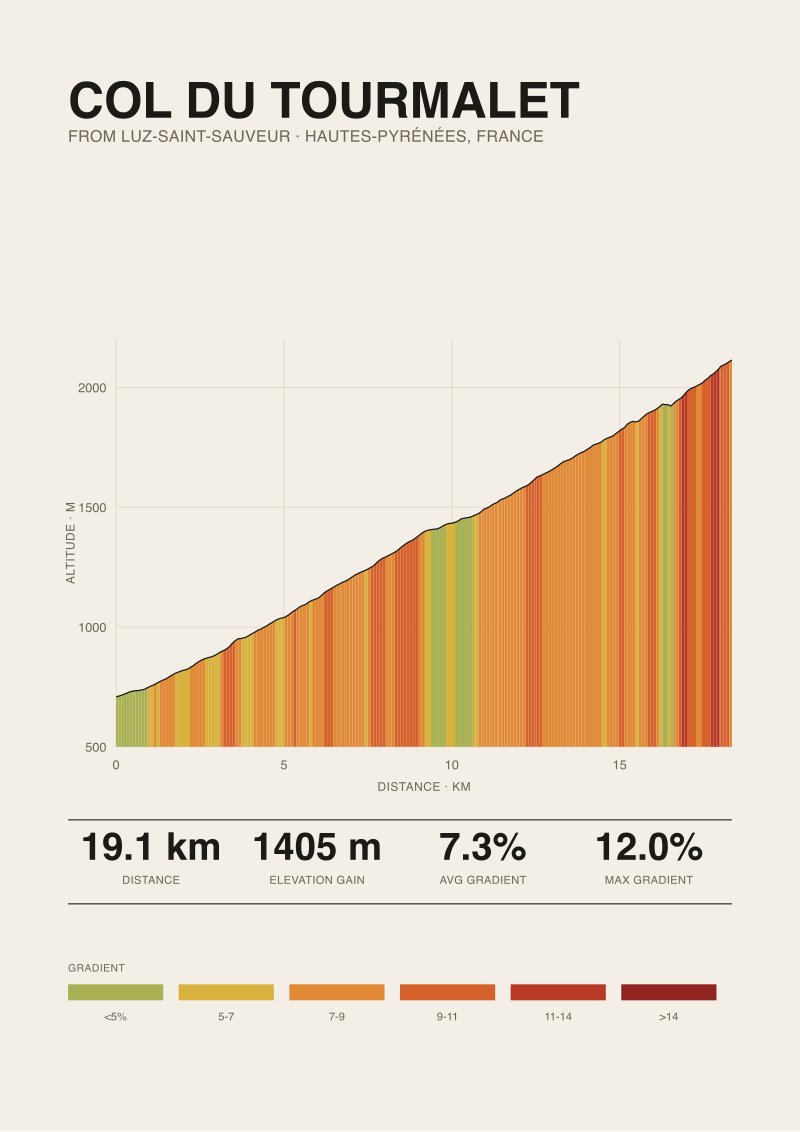
Our four climbs all satisfy at least three of those. Stelvio clears every one, summiting at 2,748 metres with 1,840 metres of gain over 25 kilometres. Gavia summits at 2,610 metres — thin air is doing real work in the last four kilometres, and no formula that treats every metre of gain as equivalent will capture that. Ventoux from Bédoin gains 1,575 metres in 21.51 kilometres, and its treeline exit means the final six kilometres are ridden in whatever weather the summit is having that afternoon, which is often not the weather down in the village. Tourmalet from Luz gains 1,405 metres in 19.12 kilometres and tops out at 2,114 metres, and its position in Tour route design for a century has made it more of a stage-defining fixture than the raw numbers alone justify. In every case, HC is a decision that these climbs deserve to be reasoned about individually rather than sorted. The category is an admission that the system stopped working.
Four Climbs, Four Categories, One Table
The table below shows what happens when you line up our four measured climbs against the two axes categorisation actually cares about — length and average gradient — plus what published road-book sources say about the maximum ramp. Every measured column is ours; the published maximum column names its source in the footnote.
| Climb (ascent) | Length (km) | Gain (m) | Avg gradient | Published max |
|---|---|---|---|---|
| Passo dello Stelvio (Prato) | 25.04 | 1,840 | 7.3% | 14.0% ¹ |
| Mont Ventoux (Bédoin) | 21.51 | 1,575 | 7.3% | 12.0% ¹ |
| Col du Tourmalet (Luz) | 19.12 | 1,405 | 7.3% | 12.0% ¹ |
| Passo di Gavia (Ponte di Legno) | 18.42 | 1,366 | 7.4% | 16.0% ² |
¹ climbfinder.com. ² climbfinder.com (Ponte di Legno). Measured columns from OpenTopoData SRTM 30 m along the ascent line.
Three observations sit inside this table. The four climbs cluster at essentially one average gradient — 7.3 to 7.4 percent — which the tiered category system cannot use to separate them. Their length varies by nearly seven kilometres from Gavia to Stelvio, which is more than a full category's worth of difference in most folk-formula treatments. And the published maximum ramp, the number the categorisation process most struggles to formalise, is where the real spread lives: 12 percent on Ventoux and Tourmalet, 14 percent on Stelvio, 16 percent on Gavia. Any classification that flattens those four maxima into a single tier is telling you less than the data already knows.
What This Does NOT Prove
Four climbs are four data points, not a survey of European road cycling. We picked them because they are the classics readers ask us about most, not because they are statistically representative of the roughly seven-tier population of catalogued European road climbs. The pattern we describe — average gradient collapsing meaningful differences, HC absorbing climbs that deserve individual treatment — is one we have observed across the wider set we work with, but nothing in this article proves it universally. A shorter, steeper climb like Belgium's Muur van Geraardsbergen or Mallorca's inner-island ramps would test the length-times-gradient folk formula from the other direction, and we have not put those climbs on the table here.
We also cannot prove intent behind race-organiser decisions. When ASO or RCS assigns a category to a climb in a given year, we are inferring the logic from the outcome; those organisations do not publish their decision matrix. Our claim that categorisation is a product decision as much as a technical one is grounded in the publicly observable inconsistency of category labels for the same road across years, not in any internal document we have seen. It is a strong inference. It is not a proof.
The Takeaway
Cycling climb categories are a rough dial the sport rotates by hand, not a formula the mathematics is doing for us. Read them as broadcast summaries, not measurements — and when the summary matters, go read the profile.
FAQ
What is the difference between Category 4 and Hors Catégorie in cycling?
Category 4 is the mildest classified climb a race organiser marks — typically a short rise that would not otherwise register in the day's narrative. Hors Catégorie sits above Category 1 and is applied to climbs the organiser considers too hard for the tiered scale to describe: usually beyond fifteen kilometres, beyond a thousand metres of gain, and above seven percent average, though no single threshold is officially fixed. The two categories bracket the entire scale and are both, in the end, judgement calls made by the race desk.
Is there an official formula for classifying climbs?
Not one that either the UCI or the major Grand Tour organisers publish. The commonly cited folk formula — length in kilometres multiplied by average gradient — predicts assigned categories often enough to be useful for back-of-envelope work, but it is not the rulebook. Race organisers make the call climb by climb, factoring in altitude, position in the stage, historical weight, and the King of the Mountains points they want available. When two race organisers classify the same road differently in different years, that is why.
Why do so many famous climbs have almost the same average gradient?
Because the road engineers who built them were solving the same problem within a similar budget. Passes designed for wheeled traffic in the nineteenth and early twentieth century tended to hold their gradient in the six-to-eight percent band because that was the ceiling a laden vehicle could climb consistently. Stelvio, Ventoux from Bédoin, Tourmalet from Luz, and Gavia from Ponte di Legno all sit at 7.3 or 7.4 percent average for that reason — the average is close to a design specification, not a coincidence.
Why does the maximum gradient of a climb come from a different source than the average?
Because the tools measure different things. Our average and length come from a satellite-derived elevation grid sampled every thirty metres along the road line, which is reliable at the whole-climb scale but blurs any ramp shorter than its own sampling window. Published maxima are compiled by climb databases from road signage, official road books, and rider surveys, which capture the sharp ramps a satellite grid smooths out. We keep the two sources labelled because trusting the satellite for the maximum would systematically understate the hardest sections.
Do UCI climb categories mean the same thing as Tour de France categories?
Not reliably. The UCI's own point scale for climbing prizes in road racing uses its own thresholds, and each Grand Tour organiser — ASO for the Tour de France, RCS for the Giro d'Italia, Unipublic for the Vuelta a España — applies the categories with their own institutional preferences. A climb that appears as Category 1 in the Vuelta may be treated as HC in the Tour, and vice versa. The five-tier vocabulary is shared. The calibration underneath is not.
Does altitude affect how a climb is categorised?
It does, but not through any documented multiplier. Race organisers routinely nudge climbs above roughly 2,000 metres into a higher category than the length-times-gradient arithmetic would suggest, because thin-air effects on rider power output start to matter in the final kilometres. Stelvio's summit at 2,748 metres and Gavia's at 2,610 both sit in a range where the last stretch is measurably harder than the same road at sea level would be. That correction happens in the organiser's judgement, not in any formula we have seen written down.
Where can I see the elevation profiles of these climbs?
The measured profiles of every climb we discuss are the source material for the prints in our own studio's shop, which is the only commercial destination we ever link. Each print renders the vertical section of the road as we sampled it — same 30-metre SRTM basis as the numbers in this article — so what you see on the wall is what the mountain actually does, ramp for ramp, not a stylised curve.
Are climb categories the same in amateur events as in professional races?
In principle yes, in practice loosely. Amateur granfondos and sportives in the Alps and Dolomites use the five-tier vocabulary because their riders recognise it from television, but the calibration is even less consistent than at the professional level. A "Cat 1" on a regional Italian granfondo profile sheet is not the same object as a Cat 1 on a Giro stage the same weekend. The categories are useful shorthand for how much the day will hurt in a given event; they do not translate across events with any precision.
From the collection


New climbs and 10% off your first print.
One email now with your code. No noise after.