Twenty-one hairpins. Every rider knows the count. Almost nobody can explain why a climb with twenty-one numbered bends produces the elevation profile it does — or what the numbers etched into a climb poster actually measure. Before spending on a print of Alpe d'Huez, or before arguing that it is somehow harder than the Stelvio's 25.04 km at 7.3 percent from Prato allo Stelvio, it helps to speak the vocabulary. This is a glossary. Nine terms that appear on every serious cycling climb poster, defined by a studio that measures elevation from OpenTopoData SRTM 30m satellite data before it draws a single line.
Average Gradient
Average gradient is the total elevation gained divided by the total distance ridden, expressed as a percentage. One number, one division. That is all.
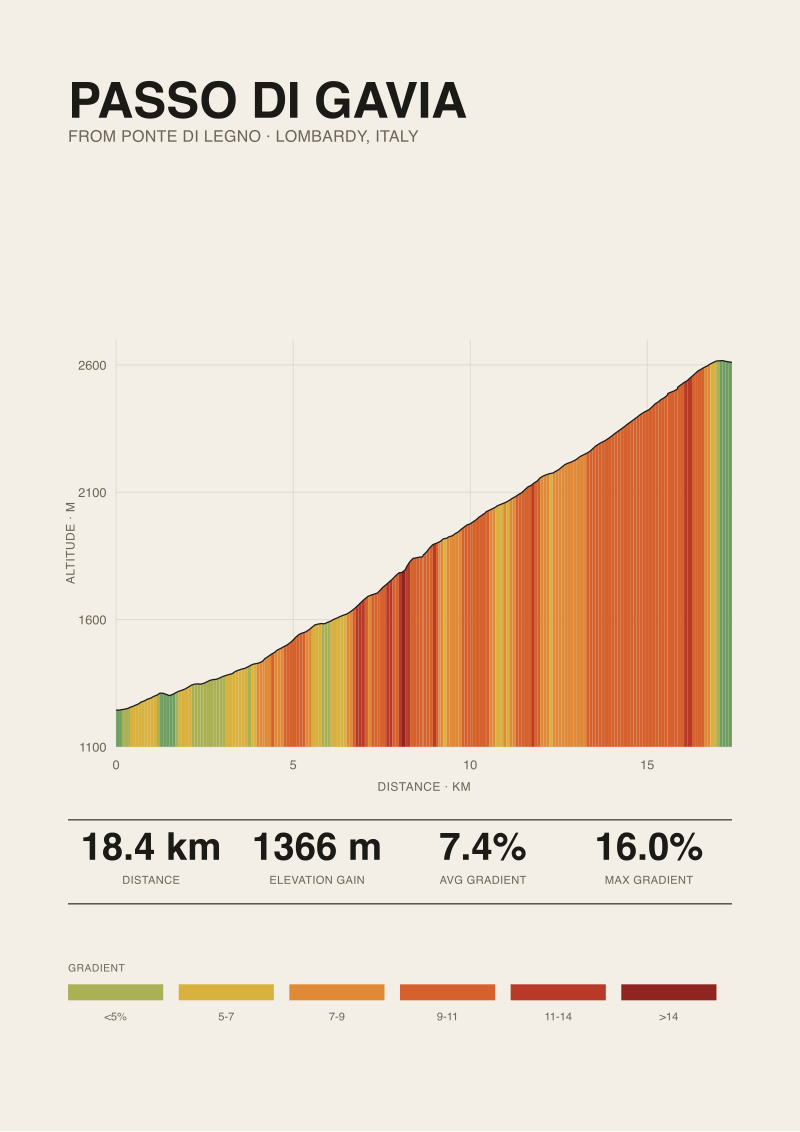
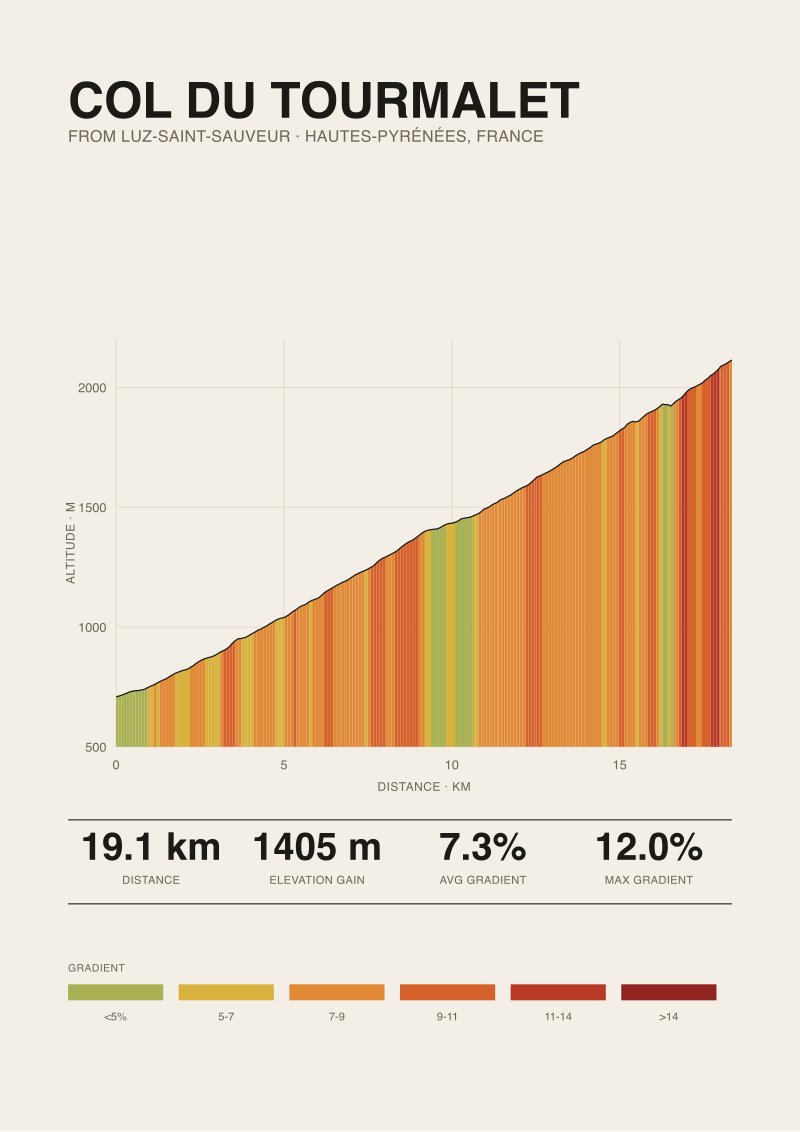
It matters because it is the number every poster leans on, and the number that flattens the story of a climb into a single digit. Four of the most famous climbs in Europe share the same average gradient to a decimal place: the Stelvio from Prato allo Stelvio (25.04 km at 7.3 percent), Mont Ventoux from Bédoin (21.51 km at 7.3 percent), the Col du Tourmalet from Luz-Saint-Sauveur (19.12 km at 7.3 percent), and the Passo di Gavia from Ponte di Legno at 7.4 percent. On paper, they are almost the same climb. In the legs they are four different climbs, because average gradient tells you nothing about where the steep parts sit, how long the flatter kilometres are, or whether the descent inside the climb erases half your accumulated pain. A poster that only tells you the average is a poster that has stopped speaking after the first sentence.
Elevation Gain
Elevation gain is the vertical metres between the start point and the summit, measured along the road. It is the honest workload of a climb: gravity does not care about your average speed, only about the height it has to lift you.
The four climbs in this grounding illustrate how gain scales. Stelvio from Prato: 1,840 metres of gain over 25.04 km. Ventoux from Bédoin: 1,575 metres over 21.51 km. Tourmalet from Luz-Saint-Sauveur: 1,405 metres over 19.12 km. Gavia from Ponte di Legno: 1,366 metres over 18.42 km. The Stelvio does 265 metres more work than Ventoux and 474 metres more than Gavia — a difference roughly equal to a mid-sized Category 3 climb sitting on top of the shorter ascents. Elevation gain is the term that separates a print of the Stelvio from a print of the Gavia even when their average gradients read almost identically. On a well-drawn poster, gain is what determines the visual amplitude of the profile line. It is the number to read first.
 Passo dello Stelvio
The print from this article · from €29.95
View the print →
Passo dello Stelvio
The print from this article · from €29.95
View the print →
Maximum Gradient (Published)
Maximum gradient is the steepest section of road on the climb, reported as a percentage. The parenthetical "published" matters: the number almost always comes from a road book, a municipal sign, or a specialist database, not from your own device.
In this grounding, published maxima come from climbfinder.com. Stelvio from Prato: 14 percent max. Ventoux from Bédoin: 12 percent max. Tourmalet from Luz-Saint-Sauveur: 12 percent max. Gavia from Ponte di Legno: 16 percent max. Note how the Gavia has the highest published max of the four despite being the shortest — a specific ramp near the bottom, above Ponte di Legno, drags the number up. The published max is a spike, not a slope you sit in. It might last 50 metres. It might last 300. A poster that gives you a max gradient without telling you where it sits on the profile is asking you to guess whether that number is a paragraph or a footnote. Always read it with the elevation profile in the same glance.
Hairpin (Tornante)
A hairpin — tornante in Italian, virage or lacet in French — is a bend of roughly 180 degrees, engineered so that a road can gain altitude on a slope too steep for a straight ascent. Each hairpin is a compromise between grade and geometry.
Alpe d'Huez's twenty-one numbered hairpins are the reason its poster exists as a visual object. The Stelvio has forty-eight numbered tornanti on its northern side from Prato allo Stelvio, stacked into the switchback wall visible from the valley floor. The Tourmalet from Luz-Saint-Sauveur is comparatively straight, which is why its 7.3 percent average gradient feels different from the Stelvio's identical 7.3: fewer hairpins means fewer moments where you get to sit up, unweight the pedals, and change your line. Hairpins are also where the road briefly flattens — the inside of a tornante is nearly always shallower than the outside — which is one reason average gradient understates the actual work being done between the bends. On a poster, hairpin count tells you the character of the ride. It does not tell you the difficulty.
 Mont Ventoux
The print from this article · from €29.95
View the print →
Mont Ventoux
The print from this article · from €29.95
View the print →
Kilometer Marker
A kilometer marker is a numbered stone or metal sign, placed roadside every 1,000 metres, typically indicating distance to the summit along with the average gradient of the kilometre you are entering. On the great European climbs, these markers are institutions.
The Ventoux markers from Bédoin are the most recognised in cycling: white pillars with black lettering, one every kilometre for 21 of them. The Stelvio from Prato has 25 to the summit at 2,748 metres. The Tourmalet from Luz-Saint-Sauveur has 19. The Gavia from Ponte di Legno has 18. A kilometre marker is more useful than a wristwatch on a climb because it tells you two things simultaneously: how much of the road remains, and what the next kilometre is going to demand. The 7.3 percent average that appears on the poster resolves into per-kilometre numbers that swing from 4 percent to 11 percent on Ventoux, from 5 percent to 10 percent on Stelvio. The markers are the resolution the average hides.
Elevation Profile
An elevation profile is a two-dimensional graph of the climb: horizontal axis is distance from the start, vertical axis is altitude above sea level. The line drawn between them is the road, seen from the side.
This is the shape a climb print is built around. A profile of Stelvio from Prato rises from 908 metres to 2,748 metres over 25.04 km — a broadly diagonal wall, kinked by the false flat in the middle third where the road threads the Trafoi valley. A profile of Ventoux from Bédoin rises from 317 metres to 1,892 metres over 21.51 km, and the shape breaks visibly at Chalet Reynard, where the forest ends and the gradient stiffens for the summit push. A profile of Gavia from Ponte di Legno starts already at 1,244 metres, meaning the print begins high and finishes at 2,610 — a shorter vertical distance rendered across an 18.42 km horizontal, but with a distinctive steep opening. A well-drawn profile is honest geometry. You should be able to feel where the ramps are.
Ramp
A ramp is a short section of road significantly steeper than the surrounding gradient — the sudden vertical bites inside an otherwise metronomic climb. Where the average gradient smooths, ramps punish.
Ramps are the reason two climbs with matching averages ride differently. The Gavia from Ponte di Legno averages 7.4 percent but publishes a 16 percent maximum: that number lives inside a ramp, not a sustained slope. The Stelvio's 14 percent published max is a ramp too, most infamously in the section above Trafoi where a sequence of tight tornanti kicks up. Ventoux from Bédoin publishes a 12 percent max, which sits inside the forest section between Saint-Estève and Chalet Reynard, the darkest and least ventilated part of the ride. Ramps are what your legs remember. On a poster, a well-drawn profile shows them as visible kinks in the line — a print that smooths the profile into a clean curve is a print that has decided marketing beats geography. Look for the kinks. They are the truth.
Summit Altitude
Summit altitude is the elevation of the highest point on the climb, measured in metres above sea level. Not the elevation gained on the day — the raw height reached.
Altitude is the term that separates climbs that hurt from climbs that hurt at low oxygen. Stelvio summit: 2,748 metres. Gavia summit: 2,610 metres. Tourmalet summit: 2,114 metres. Ventoux summit: 1,892 metres. The gap between Ventoux and Stelvio is 856 metres of thin air — enough that a rider comfortable on the Bédoin road will notice measurably slower recovery on the upper Stelvio, regardless of gradient. Summit altitude also determines what the poster ends with visually: the top of the frame. A climb ending above 2,500 metres puts a rider into terrain where a mistimed weather window matters more than a mistimed effort. It is the term that anchors the climb geographically — Ventoux is a Provençal mountain, Stelvio is an alpine pass, and the 856-metre difference tells you which weather to check.
Measured vs Published
Measured versus published is the distinction between numbers derived from an elevation dataset — in this studio's case, OpenTopoData SRTM 30m satellite data — and numbers reproduced from road books, tourism offices, or long-standing cyclist databases such as climbfinder.com.
The distinction is not academic. The Stelvio's 14 percent published maximum from Prato and the Gavia's 16 percent published maximum from Ponte di Legno are road-book values, cited to climbfinder.com in our grounding. The length figures — 25.04 km for Stelvio, 21.51 km for Ventoux, 19.12 km for Tourmalet, 18.42 km for Gavia — are measured from satellite elevation data along the road geometry, which is why the decimals go to two places rather than being rounded to the nearest kilometre. When the two disagree, it is usually because the satellite data samples elevation every 30 metres of horizontal distance and cannot see a 40-metre ramp in full resolution, while a road book was written by someone who stood on the ramp with a clinometer. Neither is wrong. They answer different questions. A serious climb poster tells you which number it drew from — and, when it matters, prints both. If you are ready to hang the climb on your wall, our shop draws the profiles from measured data and labels the published maxima separately.
FAQ
Why does an Alpe d'Huez poster usually show 21 hairpins?
Because the road up Alpe d'Huez has 21 numbered bends, counted down from Bourg-d'Oisans to the summit, and the numbering is signed on stones at each hairpin. It is the climb's most instantly recognisable graphic element — a discrete, countable feature in a discipline that otherwise trades in continuous gradients. A poster that ignores the hairpins is a poster that ignores the reason non-cyclists recognise the climb at all.
Is average gradient the best number to compare two climbs?
No, and it is often the worst. Four climbs in this article — Stelvio, Ventoux, Tourmalet, Gavia — sit at 7.3 to 7.4 percent average and ride nothing alike. Compare elevation gain, length, summit altitude and the shape of the profile before comparing averages. Average gradient is a summary statistic; the profile is the story it summarises.
What is the difference between measured and published maximum gradient?
Published maxima come from road books or specialist databases — the Stelvio's 14 percent and Gavia's 16 percent in this grounding are cited to climbfinder.com. Measured values come from an elevation dataset such as OpenTopoData SRTM 30m, sampled every 30 metres of horizontal distance. Satellite sampling can miss the exact peak of a short ramp, so measured maxima tend to run slightly lower than published ones. Reputable prints label which source they used.
Do all famous European climbs have kilometre markers?
The most famous ones do, but not all. Ventoux from Bédoin, Stelvio, Tourmalet and Gavia all carry roadside markers indicating distance to the summit and, usually, the average gradient of the next kilometre. Lesser-known passes often have only occasional signage. On a poster, the presence of numbered kilometres in the design is a fidelity signal — it means the studio consulted the actual road, not only a database.
Why do the length numbers on serious climb posters go to two decimal places?
Because the length is measured along the road geometry from an elevation dataset, not rounded from a road-book figure. Stelvio from Prato measures 25.04 km. Ventoux from Bédoin measures 21.51 km. Tourmalet from Luz-Saint-Sauveur measures 19.12 km. Gavia from Ponte di Legno measures 18.42 km. Two decimals is what happens when the climb is measured rather than remembered.
Does summit altitude affect how a climb rides?
Yes, above roughly 2,000 metres. The Ventoux summit at 1,892 metres and the Tourmalet summit at 2,114 metres are near the threshold; Gavia at 2,610 and Stelvio at 2,748 are decisively into thinner air, where recovery between efforts slows measurably regardless of gradient. It is one of the reasons two climbs with identical average gradients feel unequal.
What does the elevation profile actually show on a climb poster?
It shows the road drawn in cross-section: horizontal axis is distance from the start point, vertical axis is altitude. The shape of the line reveals ramps, false flats, and inflection points that average gradient hides. A profile of Ventoux from Bédoin clearly shows the break at Chalet Reynard where the forest ends; a profile of Stelvio from Prato shows the middle-section false flat in the Trafoi valley. The profile is the honest geometry of the climb.
From the collection

New climbs and 10% off your first print.
One email now with your code. No noise after.