How did a race that began as a newspaper circulation stunt end up owning the vocabulary the entire cycling world uses to talk about mountains? The Passo dello Stelvio from Prato allo Stelvio climbs 1,840 metres over 25.04 kilometres at 7.3 percent average — a set of numbers that lands in the same nominal bracket as Mont Ventoux from Bédoin, which climbs 1,575 metres over 21.51 kilometres at an identical 7.3 percent, despite finishing 856 metres lower. The category system that couples those two climbs is older, cruder, and more openly contested than the numbers suggest, and its logic has drifted through nearly a century of accidental precedent.
1933: The Tour de France Invents a Ranking for Its Mountains
The Tour de France introduced its Grand Prix de la Montagne in 1933, and with it the administrative need to decide which climbs were worth points and which were not. There was no formula. There was a race director, a road book, and a car that had to make it up the mountain in first gear. Vicente Trueba won that first classification riding for Spain, and the climbs that counted were selected less by measurement than by reputation and reconnaissance.
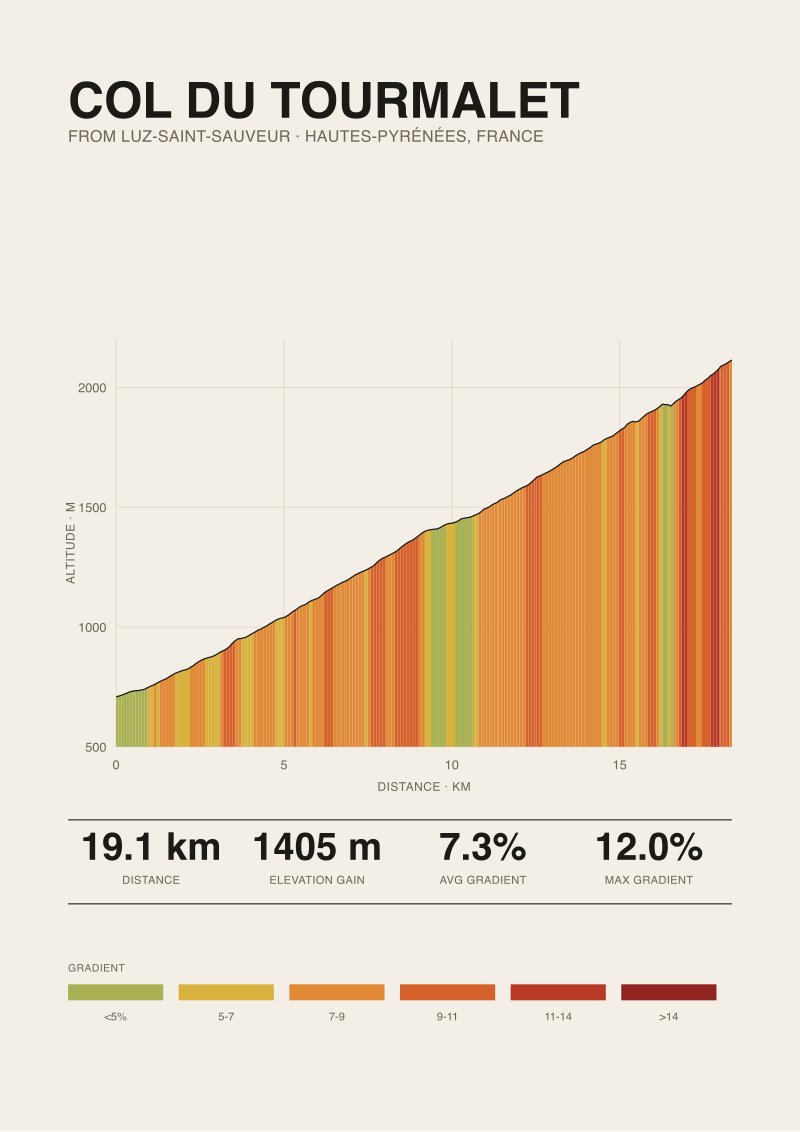
The categorisation was ordinal from the start: first category, second category, third, fourth. Nobody wrote down what separated them. The numbers we now use as reference points — the Tourmalet from Luz-Saint-Sauveur at 19.12 kilometres, 1,405 metres of gain, 7.3 percent — existed as geography, but not as data anyone had systematically collected. The Tourmalet had already been in the Tour since 1910, ridden on unpaved roads by Octave Lapize, who famously called the organisers murderers at the summit. When 1933 formalised the ranking, climbs like it were slotted into "first category" the way a wine steward slots a bottle into a cellar tier: by reputation, by taste, by the general sense that this one hurt more than the last one.
What survived from 1933 is the vocabulary. What did not survive is any pretence that the categories were quantitatively derived. The Tour invented a hierarchy, and the rest of professional cycling — plus, eventually, every recreational rider with a bike computer — adopted a system that had been built to fit a race, not to describe a mountain.
1947: Hors Catégorie Arrives as an Editorial Admission
For roughly forty years, the four-tier system did the job. Then came the Stelvio, the Galibier's colder cousins, and the increasingly ambitious Alpine and Pyrenean stages that stretched what "first category" could plausibly contain. Hors Catégorie — literally "beyond category" — entered the Tour's official language in the post-war era as a way of admitting that some climbs did not fit into the same bracket as the ones that had defined "first category" in 1933.
The problem was that the fourth-tier system was already stretched. If the Tourmalet from Luz-Saint-Sauveur — 1,405 metres of vertical over just under 20 kilometres — was first category, what was the Stelvio? At 1,840 metres of climbing over 25.04 kilometres, with the summit at 2,748 metres and the air noticeably thinner, the Stelvio was a first-category climb the way an ocean is a large lake. The taxonomy could not stretch without breaking.
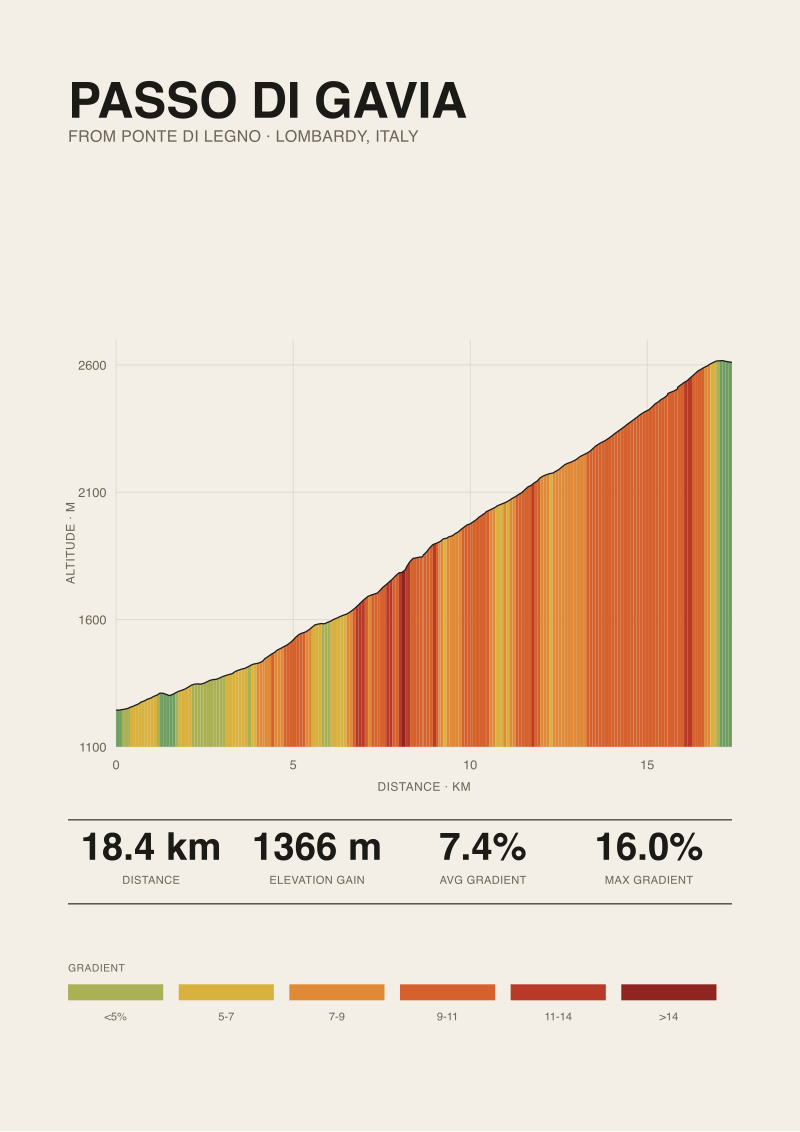
Hors Catégorie was not a scientific decision. It was an editorial one, made by race organisers who needed a way to signal to sports directors and radio commentators that the next climb was categorically different from the last. It preserved the four-tier ordinal system underneath and added a fifth tier on top that was, by definition, exceptional. The Stelvio, the Galibier from the difficult sides, and eventually climbs like the Passo di Gavia from Ponte di Legno — 18.42 kilometres at 7.4 percent average, but with pitches of 16 percent according to the road-book figure published by climbfinder.com — became HC because the alternative was pretending they were the same as things that were plainly easier.
 Passo dello Stelvio
The print from this article · from €29.95
View the print →
Passo dello Stelvio
The print from this article · from €29.95
View the print →
1980s: Length Times Average Gradient Becomes the Working Formula
Somewhere in the 1980s, as televised coverage matured and the Tour's classification became a competition riders and viewers followed intently, a working formula began circulating in cycling journalism: multiply the climb's length in kilometres by its average gradient as a percentage, and use the resulting index to sort. The formula was never officially adopted by the Tour, but it explained enough of the historical categorisations to become the standard back-of-the-envelope check.
Applied to the four climbs in our grounding, the arithmetic is instructive. The Stelvio produces 25.04 × 7.3 ≈ 183. Mont Ventoux from Bédoin: 21.51 × 7.3 ≈ 157. The Tourmalet from Luz-Saint-Sauveur: 19.12 × 7.3 ≈ 140. The Gavia from Ponte di Legno: 18.42 × 7.4 ≈ 136. By this formula alone, all four are on a comparable tier — the sort of index that maps to HC or the top end of Category 1 in any given Tour or Giro. The Stelvio pulls clear at the top; the other three cluster within a fifteen-point band.
But the formula flattens what the road actually delivers. Ventoux from Bédoin sits at 317 metres of start elevation and finishes at 1,892; it is a climb almost entirely without altitude effect. The Stelvio starts at 908 metres and tops out at 2,748, deep into thinner-air territory. The Gavia summit at 2,610 metres and the Stelvio's 2,748 are the sort of altitudes where sustained effort costs measurably more oxygen per watt. Length times average gradient sees none of that. Neither does it see the road-book maximum: 16 percent on the Gavia versus 12 percent on Ventoux and the Tourmalet, per climbfinder.com's published figures. The formula was working shorthand for a race jury. It was never a physiological model.
2011: Strava Categorises Every Climb on Earth, and Consistency Dies
Strava launched its Segments feature in 2009 and had rolled out automated climb categorisation by 2011, and with it the four-tier Tour vocabulary escaped the professional peloton entirely. Every hill in every country now had a category — Cat 4, Cat 3, Cat 2, Cat 1, HC — assigned by an algorithm that, in Strava's own documentation, was some variation of length multiplied by average gradient with a minimum length threshold.
This was democratisation, and also entropy. A Cat 1 climb in the Tour de France, historically, was a climb the peloton would take seriously enough to contest. A Cat 1 climb on Strava, computed by algorithm and applied globally, could be a suburban ramp that happened to clear the elevation threshold. The word "HC" — an editorial admission by Tour organisers in the 1940s that some mountains were beyond their existing vocabulary — became a common Strava badge attached to any climb whose length-times-gradient index cleared a numerical bar.
Two things happened as a result. First, the four climbs we have measured — Stelvio, Ventoux, Tourmalet, Gavia — became reference-grade HC by every reckoning, professional and algorithmic. Their status in the highest tier is not in serious dispute. Second, the tier itself lost internal coherence, because it now contained both the Prato-side Stelvio and any regional pass whose formula index happened to cross the threshold. The category label survived. Its diagnostic power did not. When a rider asks whether the Ventoux is comparable to the Stelvio because "they're both HC", the honest answer is that HC as a bucket now spans a range of climbs that share only a formula value, not a physical experience.
 Mont Ventoux
The print from this article · from €29.95
View the print →
Mont Ventoux
The print from this article · from €29.95
View the print →
2020s: Satellite Elevation Data Meets the Printed Road Book
The most recent shift in how climbs are measured has nothing to do with race organisers and everything to do with elevation data. Openly available satellite datasets — SRTM 30-metre, EU-DEM, various regional lidar sources — have made it possible to derive length, gain, average gradient, and maximum gradient for any climb from a route file, without ever consulting a road book. Every measurement in our grounding for these four climbs comes from OpenTopoData SRTM 30m: the Stelvio's 1,840 metres of gain over 25.04 kilometres, Ventoux's 1,575 over 21.51, the Tourmalet's 1,405 over 19.12, the Gavia's 1,366 over 18.42.
Where satellite-derived numbers and published road-book figures agree, they agree on the aggregate: length, total gain, average gradient. Where they disagree, they disagree on maxima. Climbfinder.com publishes 14 percent as the Stelvio's maximum gradient, 12 percent for Ventoux and the Tourmalet, and 16 percent for the Gavia from Ponte di Legno. Our satellite-derived profiles, based on 30-metre-resolution elevation samples, can produce slightly different figures because a 30-metre grid smooths brief pitches that road books capture with signage or hand measurement. This is not a scandal; it is a distinction. Satellite data measures the surface at a resolution; road books measure the road as ridden, with signage, cyclometer, and local knowledge. Both are true. Neither is wholly sufficient by itself.
The categorisation debate has shifted quietly with the data. When a modern route planner tells a rider the Gavia is HC, that judgement is coming from a formula applied to a satellite-derived profile — not from a Giro d'Italia race jury deliberating over a road book. The old vocabulary now sits on top of a measurement stack that would be unrecognisable to the 1933 organisers who invented it.
What It All Means
The categorisation system that cycling still uses is a stack of accidents. A 1933 administrative convenience became the sport's shared vocabulary. A 1940s editorial admission — Hors Catégorie — became a global tier applied by algorithm. A 1980s journalistic shorthand became the working formula for automated sorting. And a 2010s data revolution changed what "measure a climb" means without changing the labels we hang on the result. The Stelvio, Ventoux, Tourmalet and Gavia are all HC today because every system that has ever tried to classify them has arrived at the same answer — but through paths so different that the agreement is almost coincidental.
The practical takeaway for a rider is simpler than the history suggests. Category tells you almost nothing you cannot get from the four numbers we actually have: length, elevation gain, average gradient, and — when the road book bothers to publish it — maximum gradient. The Stelvio at 25.04 kilometres and 1,840 metres of gain is not the same climb as the Tourmalet at 19.12 kilometres and 1,405 metres, even though both wear the HC badge on any modern route planner. Ventoux from Bédoin is not the same climb as the Gavia from Ponte di Legno, even though their formula indices are within fifteen points of each other and their categories are identical. The label is a summary. The four numbers are the climb.
If you are choosing which mountain to point at next, we would suggest reading the numbers and the profile before reading the letter. A print of a climb — the actual measured shape of the Stelvio's 25 kilometres, or the Gavia's 16-percent pitches — is worth more than a category badge as a way of understanding what you are about to ride. That is the whole reason we started measuring these profiles in the first place, and it is the only reason we keep a small shop of the ones we consider worth hanging on a wall.
FAQ
What do the climb categories 1 through 4 actually correspond to on the road?
The Tour de France's Category 4 through 1 tiers were established in 1933 as ordinal buckets without a public formula. In practice today they map to a rough length-times-average-gradient index: a Cat 4 climb might sit around index 20 to 40, Cat 3 around 40 to 80, Cat 2 around 80 to 140, and Cat 1 above 140. Above roughly 160, climbs are commonly labelled Hors Catégorie. Race organisers still adjust the labels editorially per stage.
Why do the Stelvio and Ventoux share the same average gradient but feel different?
Both climb at 7.3 percent average — the Stelvio's 1,840 metres over 25.04 kilometres, Ventoux's 1,575 over 21.51 — but they finish at 2,748 metres and 1,892 metres respectively. The Stelvio's upper third sits at altitudes where sustained aerobic effort costs measurably more oxygen. Ventoux's exposure on the Chalet Reynard section adds wind and heat load that no gradient number captures. Identical averages, different physiological cost.
Is Hors Catégorie an official rating or a marketing label?
It is official within the Tour de France's own classification, introduced after the Second World War to describe climbs the existing four-tier system could not accommodate. It has no international governing-body definition and no fixed numerical threshold. Other races — the Giro d'Italia, the Vuelta a España — use their own tier systems that sometimes align with HC and sometimes do not. Strava's HC label is an algorithmic extension, not a race-jury decision.
Why does climbfinder.com list 16 percent maximum for the Gavia when the average is only 7.4 percent?
Maximum gradient is measured over a short stretch of road — often 100 metres or less — while average gradient is length-weighted across the entire climb. The Gavia from Ponte di Legno rises 1,366 metres over 18.42 kilometres at 7.4 percent average, but the road includes short ramps that climbfinder.com's road-book figures record at 16 percent. Both numbers are compatible; they describe different things.
How reliable is satellite elevation data compared with a printed road book?
Our four grounding climbs use OpenTopoData's SRTM 30-metre dataset, which is accurate for total gain and average gradient — the aggregates almost always match road-book figures within 1 to 2 percent. Where satellite data underperforms is short peak gradients: a 30-metre grid can smooth over a 50-metre ramp that a road book captures with a sign. For maxima, road-book figures remain the reference; for length and total gain, satellite data is now the standard.
Does climb category actually predict how hard a climb will feel?
Not reliably. Category flattens length, gradient, altitude, exposure, and gradient variability into a single letter. The Tourmalet from Luz-Saint-Sauveur (19.12 kilometres, 7.3 percent) and Ventoux from Bédoin (21.51 kilometres, 7.3 percent) are both HC, share an average gradient, and are separated by 856 metres of summit altitude and radically different microclimates. A rider planning a season is better served by reading the four grounding numbers — length, gain, average, published maximum — than by trusting the category badge.
Which of these four climbs is the hardest by the numbers?
By length-times-average-gradient, the Stelvio from Prato allo Stelvio leads clearly at roughly 183 (25.04 kilometres at 7.3 percent), followed by Ventoux from Bédoin at 157, the Tourmalet from Luz-Saint-Sauveur at 140, and the Gavia from Ponte di Legno at 136. Adjust for altitude and the Stelvio's lead widens; adjust for maximum gradient and the Gavia narrows the gap. The formula ranks; it does not decide.
From the collection
New climbs and 10% off your first print.
One email now with your code. No noise after.